

10 days ago
On August 5, Cencora (NYSE:COR) reported results for its fiscal third quarter, which closed on June 30, and the headline numbers looked clean. Revenue rose 5.1% to $84.8 billion, adjusted earnings per share climbed 12.0% to $4.48, and management raised its full-year adjusted EPS outlook to $17.75 to $17.95. The company also repurchased $1 billion of its own stock during the quarter. But the profit story has moving parts, and a few of them pull in opposite directions.
Start with the gap between profit growth and sales growth. Adjusted operating income rose 17.0% while revenue grew only 5.1%. Much of the help came from gross profit, which jumped 23.2% on an adjusted basis as both segments contributed and the OneOncology acquisition in February lifted margins in the US business. In plain terms, adjusted gross margin widened 61 basis points to 4.16%, so the company keeps more gross profit from every dollar it sells.
The strength was not confined to one corner, either. US Healthcare Solutions grew operating income 15.9% on higher pharmaceutical sales and the OneOncology deal, while specialty volume to health systems and physician groups lifted its revenue. International Healthcare Solutions did better still, with operating income up 20.8% on strength in European distribution and global specialty logistics. Management also put cash to work, completing in one quarter the $1 billion of buybacks it had expected to finish by the close of calendar 2026. The board declared a $0.60 quarterly dividend as well, payable August 31, to holders of record on August 14.
Growth is costing more than it first appears. Adjusted operating expenses jumped 26.8%, faster than adjusted gross profit, because OneOncology brought expenses along with its profits. Even so, adjusted operating income amounts to just 1.46% of revenue, a thin cushion on a business this large. Financing adds weight too. Cencora funded part of the purchase with new senior notes plus variable-rate term loans, and net interest expense rose $58.9 million from a year earlier.
The sales mix carries its own drag. GLP-1 drugs for diabetes and weight loss are adding to revenue, but they earn lower gross margins, so each dollar of that growth is worth less to profit. Meanwhile, an oncology customer Cencora lost in 2025, and lower sales to a large mail order customer both held back US revenue, as did lower manufacturer prices on some brand pharmaceuticals. Cencora is also exploring strategic alternatives for a group of other businesses, and its April divestiture of US Consulting Services trimmed consulting sales.
#adjusted #revenue #august
Start with the gap between profit growth and sales growth. Adjusted operating income rose 17.0% while revenue grew only 5.1%. Much of the help came from gross profit, which jumped 23.2% on an adjusted basis as both segments contributed and the OneOncology acquisition in February lifted margins in the US business. In plain terms, adjusted gross margin widened 61 basis points to 4.16%, so the company keeps more gross profit from every dollar it sells.
The strength was not confined to one corner, either. US Healthcare Solutions grew operating income 15.9% on higher pharmaceutical sales and the OneOncology deal, while specialty volume to health systems and physician groups lifted its revenue. International Healthcare Solutions did better still, with operating income up 20.8% on strength in European distribution and global specialty logistics. Management also put cash to work, completing in one quarter the $1 billion of buybacks it had expected to finish by the close of calendar 2026. The board declared a $0.60 quarterly dividend as well, payable August 31, to holders of record on August 14.
Growth is costing more than it first appears. Adjusted operating expenses jumped 26.8%, faster than adjusted gross profit, because OneOncology brought expenses along with its profits. Even so, adjusted operating income amounts to just 1.46% of revenue, a thin cushion on a business this large. Financing adds weight too. Cencora funded part of the purchase with new senior notes plus variable-rate term loans, and net interest expense rose $58.9 million from a year earlier.
The sales mix carries its own drag. GLP-1 drugs for diabetes and weight loss are adding to revenue, but they earn lower gross margins, so each dollar of that growth is worth less to profit. Meanwhile, an oncology customer Cencora lost in 2025, and lower sales to a large mail order customer both held back US revenue, as did lower manufacturer prices on some brand pharmaceuticals. Cencora is also exploring strategic alternatives for a group of other businesses, and its April divestiture of US Consulting Services trimmed consulting sales.
#adjusted #revenue #august


10 days ago
On August 6, Aflac (NYSE:AFL) reported second-quarter numbers that point in opposite directions. Net earnings climbed to $825 million, helped along by investment losses that shrank to $153 million from $421 million a year ago. Adjusted earnings, though, fell 7.7% to $883 million. Both numbers are real, but they answer different questions. Which measure you trust changes the story, so here is what sits underneath.
Start with the yen, because it is muddying the picture. The average rate was 159.45 to the dollar, 9.3% weaker than a year earlier, and that cost adjusted earnings $0.05 a share. Take the currency out of the first half and adjusted earnings per share rose 4.1% to $3.57. ******* an is also running more profitably. Its pretax adjusted margin widened to 34.3% from 32.0% as claims took a smaller bite out of premiums, and yen-based pretax adjusted earnings rose 3.4%. So part of the decline in ******* an's dollar-reported profit is currency, not operations.
The US business is still growing at the top line. Net earned premiums rose 2.3% to $1.5 billion, and sales climbed 2.6% to $349 million, led by group voluntary benefits along with dental and vision plans. In ******* an, the refreshed Tsumitasu life policy and the new Anshin Palette medical product grew strongly in the quarter, and first-half sales rose 7.0% to ¥37.3 billion. Then there is the cash. Aflac returned $1.3 billion to shareholders in the quarter, $983 million of it through buybacks, and declared a $0.61 third-quarter dividend, payable September 1 to holders of record on August 19, 2026. Management notes 43 straight years of dividend increases through 2025 and says the board is on a path to extend that in 2026.
The catch is that ******* an's profit gains came from lower claims, not a bigger business. Net earned premiums in yen fell 3.7%, mainly because of a new external reinsurance deal and older limited-pay policies reaching paid-up status. Premium persistency, the share of policies customers keep, slipped to 92.7% from 93.7%. ******* an's pretax adjusted earnings still fell 2.1% once currency is stripped out, and new sales dipped 5.6% in the quarter against a tough comparison for the Miraito cancer product, which launched in March 2025.
The US segment has its own soft spot. Pretax adjusted earnings fell 4.6% to $370 million, and the margin narrowed to 20.9% from 22.5% as claims and benefits took a bigger share of premiums. Corporate and Other swung to a $10 million pretax adjusted loss from a $20 million gain a year earlier, with interest expense up 21.6% to $62 million. And adjusted book value per share, excluding foreign currency remeasurement, slid to $41.22 at June 30 from $42.97 a year earlier.
#earnings #fell
Start with the yen, because it is muddying the picture. The average rate was 159.45 to the dollar, 9.3% weaker than a year earlier, and that cost adjusted earnings $0.05 a share. Take the currency out of the first half and adjusted earnings per share rose 4.1% to $3.57. ******* an is also running more profitably. Its pretax adjusted margin widened to 34.3% from 32.0% as claims took a smaller bite out of premiums, and yen-based pretax adjusted earnings rose 3.4%. So part of the decline in ******* an's dollar-reported profit is currency, not operations.
The US business is still growing at the top line. Net earned premiums rose 2.3% to $1.5 billion, and sales climbed 2.6% to $349 million, led by group voluntary benefits along with dental and vision plans. In ******* an, the refreshed Tsumitasu life policy and the new Anshin Palette medical product grew strongly in the quarter, and first-half sales rose 7.0% to ¥37.3 billion. Then there is the cash. Aflac returned $1.3 billion to shareholders in the quarter, $983 million of it through buybacks, and declared a $0.61 third-quarter dividend, payable September 1 to holders of record on August 19, 2026. Management notes 43 straight years of dividend increases through 2025 and says the board is on a path to extend that in 2026.
The catch is that ******* an's profit gains came from lower claims, not a bigger business. Net earned premiums in yen fell 3.7%, mainly because of a new external reinsurance deal and older limited-pay policies reaching paid-up status. Premium persistency, the share of policies customers keep, slipped to 92.7% from 93.7%. ******* an's pretax adjusted earnings still fell 2.1% once currency is stripped out, and new sales dipped 5.6% in the quarter against a tough comparison for the Miraito cancer product, which launched in March 2025.
The US segment has its own soft spot. Pretax adjusted earnings fell 4.6% to $370 million, and the margin narrowed to 20.9% from 22.5% as claims and benefits took a bigger share of premiums. Corporate and Other swung to a $10 million pretax adjusted loss from a $20 million gain a year earlier, with interest expense up 21.6% to $62 million. And adjusted book value per share, excluding foreign currency remeasurement, slid to $41.22 at June 30 from $42.97 a year earlier.
#earnings #fell


11 days ago
On September 17, Ferrari N.V. (NYSE:RACE) announced a partnership with the technology company Rakuten Group, Inc., effective January 1, 2027. The announcement gives no scope and no price tag, so it works better as a signal than as a number. The real substance sits in the results Ferrari posted on July 30, when it raised its 2026 guidance because buyers are ordering more personalization than the company expected.
In the second quarter, revenue rose 8%, but operating profit rose 10%, which means each euro of sales is leaving more behind. Ferrari credits a richer mix of cars, with the F80 helping, along with more buyers paying up for personalization. Strip out currency swings, and the gap widens, with revenue up 11% and operating profit up 16%. Deliveries of the Purosangue and the 296 Speciale family grew even in the middle of a planned model changeover.
Cash and demand back that up. Industrial free cash flow jumped 39% to €276 million, and Ferrari also returned more than €800 million to shareholders through a dividend and buybacks. Racing helped too, as higher sponsorships and engine rentals to other Formula 1 teams lifted revenue. Meanwhile, the order book covers 2027 in full, and the new 12Cilindri Manuale is already fully allocated, which is about as strong a demand signal as a carmaker can send. Those trends are why revenue guidance moved up to about €7.60 billion from about €7.50 billion.
Part of the strength is timing. Operating profit got a boost from temporarily lower depreciation and amortization while Ferrari swaps out models, and the company says those charges will climb once the new cars enter production. Net profit also leaned on a 23.0% tax rate, which reflects an estimated benefit from the new Patent Box. Neither says much about how profitable the cars themselves are.
Costs are climbing too. Higher industrial and marketing expenses weighed on operating profit, EBITDA margin slipped to 39.0% from 39.7% a year earlier, and management expects heavier brand, racing and digital spending for the year. Currency is a drag as well, mostly from the dollar and the yen, which is why 11% growth at constant currency shrank to 8% as reported. Deliveries totaled 3,366 cars while the 296 GTS, Roma Spider and SF90 XX family wound down, and sponsorship, commercial and brand revenue grew just 2%. And the whole outlook leans on current visibility into the Middle East crisis, which Ferrari cannot control.
#Ferrari
In the second quarter, revenue rose 8%, but operating profit rose 10%, which means each euro of sales is leaving more behind. Ferrari credits a richer mix of cars, with the F80 helping, along with more buyers paying up for personalization. Strip out currency swings, and the gap widens, with revenue up 11% and operating profit up 16%. Deliveries of the Purosangue and the 296 Speciale family grew even in the middle of a planned model changeover.
Cash and demand back that up. Industrial free cash flow jumped 39% to €276 million, and Ferrari also returned more than €800 million to shareholders through a dividend and buybacks. Racing helped too, as higher sponsorships and engine rentals to other Formula 1 teams lifted revenue. Meanwhile, the order book covers 2027 in full, and the new 12Cilindri Manuale is already fully allocated, which is about as strong a demand signal as a carmaker can send. Those trends are why revenue guidance moved up to about €7.60 billion from about €7.50 billion.
Part of the strength is timing. Operating profit got a boost from temporarily lower depreciation and amortization while Ferrari swaps out models, and the company says those charges will climb once the new cars enter production. Net profit also leaned on a 23.0% tax rate, which reflects an estimated benefit from the new Patent Box. Neither says much about how profitable the cars themselves are.
Costs are climbing too. Higher industrial and marketing expenses weighed on operating profit, EBITDA margin slipped to 39.0% from 39.7% a year earlier, and management expects heavier brand, racing and digital spending for the year. Currency is a drag as well, mostly from the dollar and the yen, which is why 11% growth at constant currency shrank to 8% as reported. Deliveries totaled 3,366 cars while the 296 GTS, Roma Spider and SF90 XX family wound down, and sponsorship, commercial and brand revenue grew just 2%. And the whole outlook leans on current visibility into the Middle East crisis, which Ferrari cannot control.
#Ferrari


11 days ago
On August 20, Royal Caribbean Group (NYSE:RCL) said it had completed a sale of $1.25 billion of notes that carry a 5.55% coupon and come due on January 20, 2034. The money is earmarked first for floating-rate term loans, with anything left over used to repay or refinance other debt, and the offering rode on a shelf registration filed on February 29, 2024. That sounds like routine upkeep. But next to an earnings beat and a flat third-quarter pricing outlook, the deal gives you a handy lens on where the company stands.
Start with the debt itself. Swapping floating-rate borrowings for notes with a stated 5.550% coupon takes some interest-rate guesswork out of the picture, and the notes don't mature until January 20, 2034. That matters because $2.7 billion comes due in 2027 and $3.4 billion in 2028. Against those bills, the company held $6.9 billion of liquidity as of June 30, and it added $250 million to its revolving credit line in July.
The business generating the cash is running well. On July 28, Royal Caribbean reported second-quarter adjusted earnings of $4.21 per share, ahead of its own guidance on stronger last-minute demand, lower costs, and better results from joint ventures. Management then raised full-year adjusted EPS guidance to a range of $17.73 to $17.87, which implies 14% growth. It also kept returning cash to shareholders in the second quarter, through $404 million of dividends and $199 million of buybacks. Booking volumes are running above last year, and 2027 bookings are tracking ahead of past years, even on routes that geopolitical events hit in 2026.
Beat or not, that $4.21 is still below the $4.38 from the same quarter in 2025. Costs excluding fuel per passenger cruise day rose 4.4%, and the cost beat came largely from the timing of expenses. Then there is pricing, where the story gets less rosy. Third-quarter net yields are guided to roughly flat against 2025 while capacity grows 8.5%, so the expected 8% revenue growth comes from more capacity, not from better yields. Management also says prolonged geopolitical activity has dented bookings on select itineraries. It calls the hit modest, but it is now built into guidance.
The refinancing also doesn't shrink the debt pile. New notes pay off old borrowings, so the total owed stays roughly where it was, and the company still expects net interest of $980 million to $990 million this year. Add roughly $4.7 billion of capital spending in 2026, mostly for new ships and destination projects, and it is clear this business needs a steady supply of capital. The April ship orders, Icon VI and Icon VII, extend that appetite, though their financing is already committed.
#billion #quarter #company #year
Start with the debt itself. Swapping floating-rate borrowings for notes with a stated 5.550% coupon takes some interest-rate guesswork out of the picture, and the notes don't mature until January 20, 2034. That matters because $2.7 billion comes due in 2027 and $3.4 billion in 2028. Against those bills, the company held $6.9 billion of liquidity as of June 30, and it added $250 million to its revolving credit line in July.
The business generating the cash is running well. On July 28, Royal Caribbean reported second-quarter adjusted earnings of $4.21 per share, ahead of its own guidance on stronger last-minute demand, lower costs, and better results from joint ventures. Management then raised full-year adjusted EPS guidance to a range of $17.73 to $17.87, which implies 14% growth. It also kept returning cash to shareholders in the second quarter, through $404 million of dividends and $199 million of buybacks. Booking volumes are running above last year, and 2027 bookings are tracking ahead of past years, even on routes that geopolitical events hit in 2026.
Beat or not, that $4.21 is still below the $4.38 from the same quarter in 2025. Costs excluding fuel per passenger cruise day rose 4.4%, and the cost beat came largely from the timing of expenses. Then there is pricing, where the story gets less rosy. Third-quarter net yields are guided to roughly flat against 2025 while capacity grows 8.5%, so the expected 8% revenue growth comes from more capacity, not from better yields. Management also says prolonged geopolitical activity has dented bookings on select itineraries. It calls the hit modest, but it is now built into guidance.
The refinancing also doesn't shrink the debt pile. New notes pay off old borrowings, so the total owed stays roughly where it was, and the company still expects net interest of $980 million to $990 million this year. Add roughly $4.7 billion of capital spending in 2026, mostly for new ships and destination projects, and it is clear this business needs a steady supply of capital. The April ship orders, Icon VI and Icon VII, extend that appetite, though their financing is already committed.
#billion #quarter #company #year


12 days ago
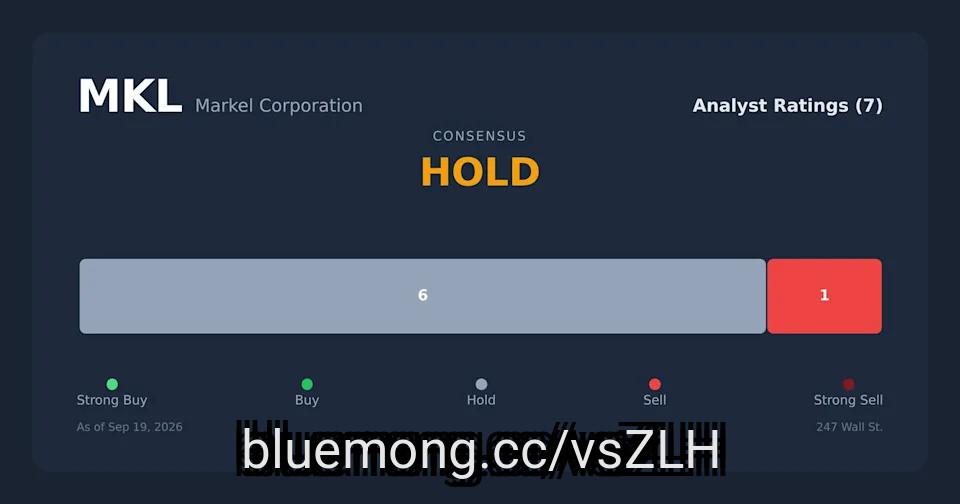
Markel mirrors Berkshire's three-engine model of insurance, equities, and operating businesses, with $18.84 billion in float and $429.5 million in 2025 buybacks, but its $22 billion market cap makes it a fundamentally different species.
Markel's combined ratio improved to 94.6% in 2025, yet shares are down 17% year to date while trailing Berkshire's 10-year return by 155 percentage points.
Three signals determine the Markel thesis: whether the combined ratio holds in the low 90s, buybacks sustain pace, and Markel Ventures remains inside the group.
Just released. Our **** ysts combed the entire stock market and named the ten best stocks to buy right now, and Berkshire Hathaway didn't make the cut. Enter your email to see the names that beat BRK-B. The report is free. Enter your email and see if any of your stocks made the cut.
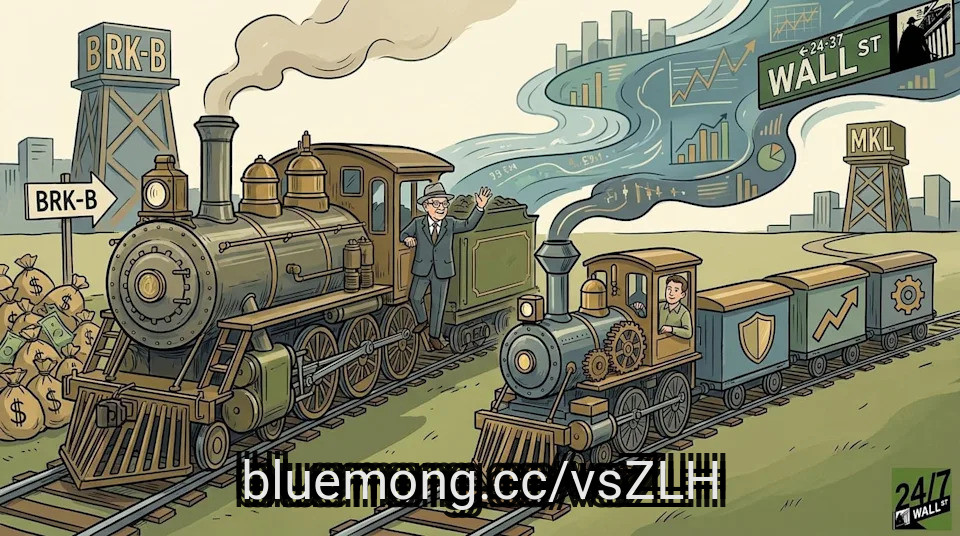
Warren Buffett has stepped down as board chair of Berkshire Hathaway, with Greg Abel now running the company. The handoff has revived a question value investors have batted around for a decade: with the Oracle off the field, is Markel Group (NYSE:MKL) the closest thing left to early Berkshire Hathaway (NYSE:BRK-B)?
#hathaway #group #market
Markel's combined ratio improved to 94.6% in 2025, yet shares are down 17% year to date while trailing Berkshire's 10-year return by 155 percentage points.
Three signals determine the Markel thesis: whether the combined ratio holds in the low 90s, buybacks sustain pace, and Markel Ventures remains inside the group.
Just released. Our **** ysts combed the entire stock market and named the ten best stocks to buy right now, and Berkshire Hathaway didn't make the cut. Enter your email to see the names that beat BRK-B. The report is free. Enter your email and see if any of your stocks made the cut.
Warren Buffett has stepped down as board chair of Berkshire Hathaway, with Greg Abel now running the company. The handoff has revived a question value investors have batted around for a decade: with the Oracle off the field, is Markel Group (NYSE:MKL) the closest thing left to early Berkshire Hathaway (NYSE:BRK-B)?
#hathaway #group #market


12 days ago
On August 5, Cencora (NYSE:COR) reported results for its fiscal third quarter, which closed on June 30, and the headline numbers looked clean. Revenue rose 5.1% to $84.8 billion, adjusted earnings per share climbed 12.0% to $4.48, and management raised its full-year adjusted EPS outlook to $17.75 to $17.95. The company also repurchased $1 billion of its own stock during the quarter. But the profit story has moving parts, and a few of them pull in opposite directions.
Start with the gap between profit growth and sales growth. Adjusted operating income rose 17.0% while revenue grew only 5.1%. Much of the help came from gross profit, which jumped 23.2% on an adjusted basis as both segments contributed and the OneOncology acquisition in February lifted margins in the US business. In plain terms, adjusted gross margin widened 61 basis points to 4.16%, so the company keeps more gross profit from every dollar it sells.
The strength was not confined to one corner, either. US Healthcare Solutions grew operating income 15.9% on higher pharmaceutical sales and the OneOncology deal, while specialty volume to health systems and physician groups lifted its revenue. International Healthcare Solutions did better still, with operating income up 20.8% on strength in European distribution and global specialty logistics. Management also put cash to work, completing in one quarter the $1 billion of buybacks it had expected to finish by the close of calendar 2026. The board declared a $0.60 quarterly dividend as well, payable August 31, to holders of record on August 14.
Growth is costing more than it first appears. Adjusted operating expenses jumped 26.8%, faster than adjusted gross profit, because OneOncology brought expenses along with its profits. Even so, adjusted operating income amounts to just 1.46% of revenue, a thin cushion on a business this large. Financing adds weight too. Cencora funded part of the purchase with new senior notes plus variable-rate term loans, and net interest expense rose $58.9 million from a year earlier.
The sales mix carries its own drag. GLP-1 drugs for diabetes and weight loss are adding to revenue, but they earn lower gross margins, so each dollar of that growth is worth less to profit. Meanwhile, an oncology customer Cencora lost in 2025, and lower sales to a large mail order customer both held back US revenue, as did lower manufacturer prices on some brand pharmaceuticals. Cencora is also exploring strategic alternatives for a group of other businesses, and its April divestiture of US Consulting Services trimmed consulting sales.
#profit #operating #Growth #august
Start with the gap between profit growth and sales growth. Adjusted operating income rose 17.0% while revenue grew only 5.1%. Much of the help came from gross profit, which jumped 23.2% on an adjusted basis as both segments contributed and the OneOncology acquisition in February lifted margins in the US business. In plain terms, adjusted gross margin widened 61 basis points to 4.16%, so the company keeps more gross profit from every dollar it sells.
The strength was not confined to one corner, either. US Healthcare Solutions grew operating income 15.9% on higher pharmaceutical sales and the OneOncology deal, while specialty volume to health systems and physician groups lifted its revenue. International Healthcare Solutions did better still, with operating income up 20.8% on strength in European distribution and global specialty logistics. Management also put cash to work, completing in one quarter the $1 billion of buybacks it had expected to finish by the close of calendar 2026. The board declared a $0.60 quarterly dividend as well, payable August 31, to holders of record on August 14.
Growth is costing more than it first appears. Adjusted operating expenses jumped 26.8%, faster than adjusted gross profit, because OneOncology brought expenses along with its profits. Even so, adjusted operating income amounts to just 1.46% of revenue, a thin cushion on a business this large. Financing adds weight too. Cencora funded part of the purchase with new senior notes plus variable-rate term loans, and net interest expense rose $58.9 million from a year earlier.
The sales mix carries its own drag. GLP-1 drugs for diabetes and weight loss are adding to revenue, but they earn lower gross margins, so each dollar of that growth is worth less to profit. Meanwhile, an oncology customer Cencora lost in 2025, and lower sales to a large mail order customer both held back US revenue, as did lower manufacturer prices on some brand pharmaceuticals. Cencora is also exploring strategic alternatives for a group of other businesses, and its April divestiture of US Consulting Services trimmed consulting sales.
#profit #operating #Growth #august


12 days ago
On August 6, Aflac (NYSE:AFL) reported second-quarter numbers that point in opposite directions. Net earnings climbed to $825 million, helped along by investment losses that shrank to $153 million from $421 million a year ago. Adjusted earnings, though, fell 7.7% to $883 million. Both numbers are real, but they answer different questions. Which measure you trust changes the story, so here is what sits underneath.
Start with the yen, because it is muddying the picture. The average rate was 159.45 to the dollar, 9.3% weaker than a year earlier, and that cost adjusted earnings $0.05 a share. Take the currency out of the first half and adjusted earnings per share rose 4.1% to $3.57. **** an is also running more profitably. Its pretax adjusted margin widened to 34.3% from 32.0% as claims took a smaller bite out of premiums, and yen-based pretax adjusted earnings rose 3.4%. So part of the decline in **** an's dollar-reported profit is currency, not operations.
The US business is still growing at the top line. Net earned premiums rose 2.3% to $1.5 billion, and sales climbed 2.6% to $349 million, led by group voluntary benefits along with dental and vision plans. In **** an, the refreshed Tsumitasu life policy and the new Anshin Palette medical product grew strongly in the quarter, and first-half sales rose 7.0% to ¥37.3 billion. Then there is the cash. Aflac returned $1.3 billion to shareholders in the quarter, $983 million of it through buybacks, and declared a $0.61 third-quarter dividend, payable September 1 to holders of record on August 19, 2026. Management notes 43 straight years of dividend increases through 2025 and says the board is on a path to extend that in 2026.
The catch is that **** an's profit gains came from lower claims, not a bigger business. Net earned premiums in yen fell 3.7%, mainly because of a new external reinsurance deal and older limited-pay policies reaching paid-up status. Premium persistency, the share of policies customers keep, slipped to 92.7% from 93.7%. **** an's pretax adjusted earnings still fell 2.1% once currency is stripped out, and new sales dipped 5.6% in the quarter against a tough comparison for the Miraito cancer product, which launched in March 2025.
The US segment has its own soft spot. Pretax adjusted earnings fell 4.6% to $370 million, and the margin narrowed to 20.9% from 22.5% as claims and benefits took a bigger share of premiums. Corporate and Other swung to a $10 million pretax adjusted loss from a $20 million gain a year earlier, with interest expense up 21.6% to $62 million. And adjusted book value per share, excluding foreign currency remeasurement, slid to $41.22 at June 30 from $42.97 a year earlier.
#adjusted #pretax
Start with the yen, because it is muddying the picture. The average rate was 159.45 to the dollar, 9.3% weaker than a year earlier, and that cost adjusted earnings $0.05 a share. Take the currency out of the first half and adjusted earnings per share rose 4.1% to $3.57. **** an is also running more profitably. Its pretax adjusted margin widened to 34.3% from 32.0% as claims took a smaller bite out of premiums, and yen-based pretax adjusted earnings rose 3.4%. So part of the decline in **** an's dollar-reported profit is currency, not operations.
The US business is still growing at the top line. Net earned premiums rose 2.3% to $1.5 billion, and sales climbed 2.6% to $349 million, led by group voluntary benefits along with dental and vision plans. In **** an, the refreshed Tsumitasu life policy and the new Anshin Palette medical product grew strongly in the quarter, and first-half sales rose 7.0% to ¥37.3 billion. Then there is the cash. Aflac returned $1.3 billion to shareholders in the quarter, $983 million of it through buybacks, and declared a $0.61 third-quarter dividend, payable September 1 to holders of record on August 19, 2026. Management notes 43 straight years of dividend increases through 2025 and says the board is on a path to extend that in 2026.
The catch is that **** an's profit gains came from lower claims, not a bigger business. Net earned premiums in yen fell 3.7%, mainly because of a new external reinsurance deal and older limited-pay policies reaching paid-up status. Premium persistency, the share of policies customers keep, slipped to 92.7% from 93.7%. **** an's pretax adjusted earnings still fell 2.1% once currency is stripped out, and new sales dipped 5.6% in the quarter against a tough comparison for the Miraito cancer product, which launched in March 2025.
The US segment has its own soft spot. Pretax adjusted earnings fell 4.6% to $370 million, and the margin narrowed to 20.9% from 22.5% as claims and benefits took a bigger share of premiums. Corporate and Other swung to a $10 million pretax adjusted loss from a $20 million gain a year earlier, with interest expense up 21.6% to $62 million. And adjusted book value per share, excluding foreign currency remeasurement, slid to $41.22 at June 30 from $42.97 a year earlier.
#adjusted #pretax


13 days ago
Core & Main, Inc. (NYSE:CNM) reported quarterly sales of $2.145 billion on September 9, up 2.5%. Company-defined non-GAAP adjusted EBITDA reached $274 million. The measure adjusts consolidated net income for interest, taxes, depreciation and amortization, equity compensation, debt modification and extinguishment losses, offering expenses, and specified other income or expenses.
Consolidated net income rose 6.4% to $150 million, while GAAP diluted earnings per share increased 10% to $0.77. Diluted weighted-average shares declined approximately 2.5% to 193.4 million. Buybacks amplified an improvement that also had an operating foundation.
The company repurchased $169 million of equity during the quarter, against $62 million of operating cash flow. The investment question is whether cash generation can sustain capital returns alongside the spending needed to grow.
Core & Main, Inc. (NYSE:CNM) benefits from demand for essential infrastructure products. Management highlighted municipal demand, fire protection, treatment plants, and data centers as areas of strength. These end markets provide several sources of business even when construction demand is uneven.
Expense discipline also helped. Quarterly selling, general and administrative expenses declined to $301 million from $302 million. Controlling overhead allows modest sales growth to contribute more to earnings. Stronger volumes would make further earnings gains easier to sustain.
#income #main #quarterly
Consolidated net income rose 6.4% to $150 million, while GAAP diluted earnings per share increased 10% to $0.77. Diluted weighted-average shares declined approximately 2.5% to 193.4 million. Buybacks amplified an improvement that also had an operating foundation.
The company repurchased $169 million of equity during the quarter, against $62 million of operating cash flow. The investment question is whether cash generation can sustain capital returns alongside the spending needed to grow.
Core & Main, Inc. (NYSE:CNM) benefits from demand for essential infrastructure products. Management highlighted municipal demand, fire protection, treatment plants, and data centers as areas of strength. These end markets provide several sources of business even when construction demand is uneven.
Expense discipline also helped. Quarterly selling, general and administrative expenses declined to $301 million from $302 million. Controlling overhead allows modest sales growth to contribute more to earnings. Stronger volumes would make further earnings gains easier to sustain.
#income #main #quarterly


13 days ago
GPC's unbroken dividend streak since 1999 yields 3%, while LKQ's 5% yield trades below book value with a Goldman-led strategic review pending.
Gentex runs a nearly debt-free balance sheet, with $1.89 trailing EPS covering its $0.48 annual dividend and aggressive buybacks shrinking the share count.
Read More: Avoid these 13 retirement mistakes before they derail your future (sponsor)
Repair demand is the quiet defensive layer inside a cyclical industry. Americans are keeping cars longer, and every mile driven eventually needs a filter, a mirror, a ***** per cover, or a brake caliper. That reality is why a small group of US-listed auto parts names have been able to send cash to shareholders through recessions, tariff scares, and new-vehicle slumps. The three names below all pay a verified dividend, span both aftermarket distribution and original-equipment supply, and range from a 2.13% yield backed by a debt-free balance sheet to a 5.05% yield trading below book value.
Genuine Parts (NYSE:GPC) is the NAPA owner and the closest thing this bundle has to an income staple. The stock yields 3.13% at a recent price of $131.45, with a quarterly payout of $1.0625 per share and an annualized run rate of $4.25.
#free
Gentex runs a nearly debt-free balance sheet, with $1.89 trailing EPS covering its $0.48 annual dividend and aggressive buybacks shrinking the share count.
Read More: Avoid these 13 retirement mistakes before they derail your future (sponsor)
Repair demand is the quiet defensive layer inside a cyclical industry. Americans are keeping cars longer, and every mile driven eventually needs a filter, a mirror, a ***** per cover, or a brake caliper. That reality is why a small group of US-listed auto parts names have been able to send cash to shareholders through recessions, tariff scares, and new-vehicle slumps. The three names below all pay a verified dividend, span both aftermarket distribution and original-equipment supply, and range from a 2.13% yield backed by a debt-free balance sheet to a 5.05% yield trading below book value.
Genuine Parts (NYSE:GPC) is the NAPA owner and the closest thing this bundle has to an income staple. The stock yields 3.13% at a recent price of $131.45, with a quarterly payout of $1.0625 per share and an annualized run rate of $4.25.
#free


13 days ago
York Water holds the longest dividend streak in US public markets at 27 consecutive years, while WTW's $1.775B operating cash flow dwarfs its $358M dividend obligation.
Amdocs and Ituran both run near-recession-proof revenue models, with DOX posting near-100% managed services renewal rates and ITRN carrying zero debt alongside $103.7M in net cash.
All five stocks fund dividends from contracted or recurring revenue streams such as regulated rates, fee income, or subscriptions, insulating payouts from economic cycles.
Read More: Learn 7 secret wealth tips high net worth investors use that most investors miss (sponsor)
Income investors heading into the fourth quarter want payouts that don't wobble with the business cycle. The five names below share one thing: dividends funded by recurring, contracted, or fee-based revenue streams that keep flowing whether or not the macro cooperates. Each has raised its payout recently, and each trades on Nasdaq. As a grounding data point, Willis Towers Watson (NASDAQ:WTW) alone generated $360 million of first-half free cash flow, roughly double the prior-year period, giving the broker ample room to keep funding both dividends and buybacks.
#revenue #NASDAQ #Dividend
Amdocs and Ituran both run near-recession-proof revenue models, with DOX posting near-100% managed services renewal rates and ITRN carrying zero debt alongside $103.7M in net cash.
All five stocks fund dividends from contracted or recurring revenue streams such as regulated rates, fee income, or subscriptions, insulating payouts from economic cycles.
Read More: Learn 7 secret wealth tips high net worth investors use that most investors miss (sponsor)
Income investors heading into the fourth quarter want payouts that don't wobble with the business cycle. The five names below share one thing: dividends funded by recurring, contracted, or fee-based revenue streams that keep flowing whether or not the macro cooperates. Each has raised its payout recently, and each trades on Nasdaq. As a grounding data point, Willis Towers Watson (NASDAQ:WTW) alone generated $360 million of first-half free cash flow, roughly double the prior-year period, giving the broker ample room to keep funding both dividends and buybacks.
#revenue #NASDAQ #Dividend


14 days ago
Answering a caller's query about The Procter & Gamble Company (NYSE:PG) during the lightning round of the September 10 episode of Mad Money, Jim Cramer said:
It's a tough stock. It's a tough stock because they don't have the growth that I want. They do have the 3% yield, but that's not enough. So, I'm going to say, you know, we sold it for the club. Don't look back.
The Procter & Gamble Company's (NYSE:PG) upside relies on elite operational execution and pricing power in high-margin categories. Continuous supply chain savings and an aggressive premiumization push toward items like Tide PODS help protect profitability. Combined with strong free cash flow productivity, management returned roughly $15 billion in FY 2026 through dividends and share buybacks, ensuring a steady earnings floor despite slow top-line growth.
The primary headwind is weak top-line momentum, with organic sales flat in the second quarter as challenging consumer trends, particularly in the U.S., weighed on growth. Foreign exchange friction and cost pressures further cap near-term earnings acceleration. Additionally, while the stock offers a reliable 3% dividend yield, that income profile creates a steep opportunity cost when risk-free ******* ets and higher-growth stocks offer attractive returns. We recently discussed what Cramer thinks is the ideal valuation for a good entry point in our article, "Jim Cramer Discusses Procter & Gamble (PG) Valuation and Growth."
According to Insider Monkey's data, 83 hedge funds had a stake in The Procter & Gamble Company (NYSE:PG) in Q2 compared to 78 in the prior quarter. Short percentage of the float is 1.21%, showing its status as a defensive holding rather than a short target. While the company provides exceptional balance sheet stability and reliable cash returns for defensive portfolios, its modest top-line growth trajectory and premium valuation continue to test investor patience, validating Cramer's decision to reallocate capital toward faster-moving opportunities.
#company
It's a tough stock. It's a tough stock because they don't have the growth that I want. They do have the 3% yield, but that's not enough. So, I'm going to say, you know, we sold it for the club. Don't look back.
The Procter & Gamble Company's (NYSE:PG) upside relies on elite operational execution and pricing power in high-margin categories. Continuous supply chain savings and an aggressive premiumization push toward items like Tide PODS help protect profitability. Combined with strong free cash flow productivity, management returned roughly $15 billion in FY 2026 through dividends and share buybacks, ensuring a steady earnings floor despite slow top-line growth.
The primary headwind is weak top-line momentum, with organic sales flat in the second quarter as challenging consumer trends, particularly in the U.S., weighed on growth. Foreign exchange friction and cost pressures further cap near-term earnings acceleration. Additionally, while the stock offers a reliable 3% dividend yield, that income profile creates a steep opportunity cost when risk-free ******* ets and higher-growth stocks offer attractive returns. We recently discussed what Cramer thinks is the ideal valuation for a good entry point in our article, "Jim Cramer Discusses Procter & Gamble (PG) Valuation and Growth."
According to Insider Monkey's data, 83 hedge funds had a stake in The Procter & Gamble Company (NYSE:PG) in Q2 compared to 78 in the prior quarter. Short percentage of the float is 1.21%, showing its status as a defensive holding rather than a short target. While the company provides exceptional balance sheet stability and reliable cash returns for defensive portfolios, its modest top-line growth trajectory and premium valuation continue to test investor patience, validating Cramer's decision to reallocate capital toward faster-moving opportunities.
#company


14 days ago
Enova International Inc (NYSE:ENVA) withdrew regulatory applications for its planned Grasshopper Bancorp acquisition on Tuesday, sending shares sharply lower despite reaffirmed growth forecasts and plans for faster buybacks.
Shares fell 25% to $169.50 following the company's acquisition update.
The technology and ******* ytics company pulled applications with the Office of the Comptroller of the Currency and the Federal Reserve after reviewing the transaction and bank approval process.
CEO Steve Cunningham said withdrawing the applications was the best choice for Enova and its shareholders, adding that the company can keep growing without becoming a bank.
He argued that banking rules have not kept pace with the credit needs of consumers and small businesses that banks do not adequately serve.
#acquisition #bank #international
Shares fell 25% to $169.50 following the company's acquisition update.
The technology and ******* ytics company pulled applications with the Office of the Comptroller of the Currency and the Federal Reserve after reviewing the transaction and bank approval process.
CEO Steve Cunningham said withdrawing the applications was the best choice for Enova and its shareholders, adding that the company can keep growing without becoming a bank.
He argued that banking rules have not kept pace with the credit needs of consumers and small businesses that banks do not adequately serve.
#acquisition #bank #international


14 days ago
Citigroup Inc. (NYSE:C)'s CFO Gonzalo Luchetti said the bank expects return on tangible common equity (RoTCE) to come in slightly above 11% in 2026, while also indicating that Citi will increase stock buybacks from the $13 billion repurchased in 2025. The bank plans to accelerate roughly $500 million of investment by year-end, including spending on severance and marketing intended to expand its credit-card and wealth-management businesses. Citi also expects to remove Banamex from its balance sheet in 2027, which will create an estimated $9 billion currency-translation adjustment loss.
The 11%+ target is meaningful because Citi's profitability has already improved materially. In the second quarter, Citi generated $24.8 billion of revenue, up 14% year over year, while net income rose 45% to $5.8 billion. Investment-banking revenue increased 44% to $1.55 billion, and net interest income increased 13%. Citi's SEC filing shows second-quarter RoTCE of 13.0%, versus 8.7% a year earlier, while the first half of 2026 produced a 13.1% RoTCE. The new guidance therefore suggests management believes profitability can remain above the longer-term 11%-13% RoTCE range Citi established for 2027-28, despite additional investment spending.
Kiev.Victor / Shutterstock.com
The bullish argument is that Citigroup Inc. (NYSE:C) appears to be converting its multiyear restructuring into higher returns while simultaneously returning more capital to shareholders. The move from 8.7% RoTCE in the second quarter of 2025 to 13.0% in the second quarter of 2026 represents a substantial improvement in capital efficiency. Citi's efficiency ratio also improved to 57.4% from 62.7%, indicating that revenue growth is increasingly translating into operating leverage rather than being absorbed by expenses. That is particularly relevant because management now intends to spend another roughly $500 million on severance, marketing, and growth initiatives; if these investments produce the intended expansion in cards and wealth management, they could support revenue growth without derailing the profitability trajectory.
Capital returns provide another positive lever. Citi repurchased $13 billion of stock in 2025 and now expects to increase that amount, while its June 2026 CET1 ratio remained 12.78%, comfortably above its 11.6% standardized regulatory requirement. Buybacks can reduce tangible common equity and shares outstanding, potentially supporting both RoTCE and per-share earnings when executed below intrinsic value. Citi's tangible book value per share had already risen 7% year over year to $100.89 by June 30, 2026. The combination of higher operating profitability, shrinking share count, and improving capital efficiency strengthens the case for a valuation re-rating if Citi can sustain returns above 11%.
#rotce #citi #management
The 11%+ target is meaningful because Citi's profitability has already improved materially. In the second quarter, Citi generated $24.8 billion of revenue, up 14% year over year, while net income rose 45% to $5.8 billion. Investment-banking revenue increased 44% to $1.55 billion, and net interest income increased 13%. Citi's SEC filing shows second-quarter RoTCE of 13.0%, versus 8.7% a year earlier, while the first half of 2026 produced a 13.1% RoTCE. The new guidance therefore suggests management believes profitability can remain above the longer-term 11%-13% RoTCE range Citi established for 2027-28, despite additional investment spending.
Kiev.Victor / Shutterstock.com
The bullish argument is that Citigroup Inc. (NYSE:C) appears to be converting its multiyear restructuring into higher returns while simultaneously returning more capital to shareholders. The move from 8.7% RoTCE in the second quarter of 2025 to 13.0% in the second quarter of 2026 represents a substantial improvement in capital efficiency. Citi's efficiency ratio also improved to 57.4% from 62.7%, indicating that revenue growth is increasingly translating into operating leverage rather than being absorbed by expenses. That is particularly relevant because management now intends to spend another roughly $500 million on severance, marketing, and growth initiatives; if these investments produce the intended expansion in cards and wealth management, they could support revenue growth without derailing the profitability trajectory.
Capital returns provide another positive lever. Citi repurchased $13 billion of stock in 2025 and now expects to increase that amount, while its June 2026 CET1 ratio remained 12.78%, comfortably above its 11.6% standardized regulatory requirement. Buybacks can reduce tangible common equity and shares outstanding, potentially supporting both RoTCE and per-share earnings when executed below intrinsic value. Citi's tangible book value per share had already risen 7% year over year to $100.89 by June 30, 2026. The combination of higher operating profitability, shrinking share count, and improving capital efficiency strengthens the case for a valuation re-rating if Citi can sustain returns above 11%.
#rotce #citi #management


14 days ago
Citigroup Inc. (NYSE:C)'s CFO Gonzalo Luchetti said the bank expects return on tangible common equity (RoTCE) to come in slightly above 11% in 2026, while also indicating that Citi will increase stock buybacks from the $13 billion repurchased in 2025. The bank plans to accelerate roughly $500 million of investment by year-end, including spending on severance and marketing intended to expand its credit-card and wealth-management businesses. Citi also expects to remove Banamex from its balance sheet in 2027, which will create an estimated $9 billion currency-translation adjustment loss.
The 11%+ target is meaningful because Citi's profitability has already improved materially. In the second quarter, Citi generated $24.8 billion of revenue, up 14% year over year, while net income rose 45% to $5.8 billion. Investment-banking revenue increased 44% to $1.55 billion, and net interest income increased 13%. Citi's SEC filing shows second-quarter RoTCE of 13.0%, versus 8.7% a year earlier, while the first half of 2026 produced a 13.1% RoTCE. The new guidance therefore suggests management believes profitability can remain above the longer-term 11%-13% RoTCE range Citi established for 2027-28, despite additional investment spending.
Kiev.Victor / Shutterstock.com
The bullish argument is that Citigroup Inc. (NYSE:C) appears to be converting its multiyear restructuring into higher returns while simultaneously returning more capital to shareholders. The move from 8.7% RoTCE in the second quarter of 2025 to 13.0% in the second quarter of 2026 represents a substantial improvement in capital efficiency. Citi's efficiency ratio also improved to 57.4% from 62.7%, indicating that revenue growth is increasingly translating into operating leverage rather than being absorbed by expenses. That is particularly relevant because management now intends to spend another roughly $500 million on severance, marketing, and growth initiatives; if these investments produce the intended expansion in cards and wealth management, they could support revenue growth without derailing the profitability trajectory.
Capital returns provide another positive lever. Citi repurchased $13 billion of stock in 2025 and now expects to increase that amount, while its June 2026 CET1 ratio remained 12.78%, comfortably above its 11.6% standardized regulatory requirement. Buybacks can reduce tangible common equity and shares outstanding, potentially supporting both RoTCE and per-share earnings when executed below intrinsic value. Citi's tangible book value per share had already risen 7% year over year to $100.89 by June 30, 2026. The combination of higher operating profitability, shrinking share count, and improving capital efficiency strengthens the case for a valuation re-rating if Citi can sustain returns above 11%.
#year #management
The 11%+ target is meaningful because Citi's profitability has already improved materially. In the second quarter, Citi generated $24.8 billion of revenue, up 14% year over year, while net income rose 45% to $5.8 billion. Investment-banking revenue increased 44% to $1.55 billion, and net interest income increased 13%. Citi's SEC filing shows second-quarter RoTCE of 13.0%, versus 8.7% a year earlier, while the first half of 2026 produced a 13.1% RoTCE. The new guidance therefore suggests management believes profitability can remain above the longer-term 11%-13% RoTCE range Citi established for 2027-28, despite additional investment spending.
Kiev.Victor / Shutterstock.com
The bullish argument is that Citigroup Inc. (NYSE:C) appears to be converting its multiyear restructuring into higher returns while simultaneously returning more capital to shareholders. The move from 8.7% RoTCE in the second quarter of 2025 to 13.0% in the second quarter of 2026 represents a substantial improvement in capital efficiency. Citi's efficiency ratio also improved to 57.4% from 62.7%, indicating that revenue growth is increasingly translating into operating leverage rather than being absorbed by expenses. That is particularly relevant because management now intends to spend another roughly $500 million on severance, marketing, and growth initiatives; if these investments produce the intended expansion in cards and wealth management, they could support revenue growth without derailing the profitability trajectory.
Capital returns provide another positive lever. Citi repurchased $13 billion of stock in 2025 and now expects to increase that amount, while its June 2026 CET1 ratio remained 12.78%, comfortably above its 11.6% standardized regulatory requirement. Buybacks can reduce tangible common equity and shares outstanding, potentially supporting both RoTCE and per-share earnings when executed below intrinsic value. Citi's tangible book value per share had already risen 7% year over year to $100.89 by June 30, 2026. The combination of higher operating profitability, shrinking share count, and improving capital efficiency strengthens the case for a valuation re-rating if Citi can sustain returns above 11%.
#year #management


17 days ago
On September 10, Copart (NASDAQ:CPRT) held its fourth-quarter earnings call and used it to unveil a deal that could reshape its business: an all-cash agreement to acquire ACV, a digital auto marketplace that moved roughly $10 billion of vehicles last year without owning a single lot. The announcement landed alongside a quarter that captured the company's central tension. Revenue rose, but net income fell, and management is now betting that pairing its junkyards with someone else's software can fix that.
The ACV deal is the headline, and for good reason. ACV brings more than 22,000 active buyers and inspection and valuation technology, while Copart contributes over 275 locations, roughly 4 million vehicles sold annually, and about 1 million members across more than 185 countries. Management structured it as an all-cash tender offer funded from cash on hand, with a close targeted by the end of the calendar year and earnings accretion expected in fiscal 2028. Executives framed the fit as physical scale meeting digital liquidity, giving dealers, banks, and fleet sellers a single partner for disposing of vehicles.
That diversification push is already showing up in the numbers. International revenue grew 11.7% to $222.1 million on 15% service revenue growth, and international buyers accounted for 45.7% of total US sales dollars despite making up only 38.2% of units, a sign they are chasing pricier vehicles. Domestically, non-insurance units returned to growth of 0.2% in the quarter after a full-year decline, dealer units rose 5.8%, and BluCar, which serves banks and fleets, expanded nearly 20%. Global average selling prices climbed 3.5%, evidence that Copart's auctions still command pricing power even as volumes soften.
The quarter's numbers show where the strain is. Consolidated revenue grew 2.4% to $1.2 billion, yet net income dropped 17.4% to $327.4 million and diluted earnings per share fell 14.6% to $0.35. Operating expense per car jumped 12.7% year over year as the company poured money into long-haul delivery, **** leExpress, and dedicated wholesale facilities, and US facility costs alone rose 7.7% in the quarter. Lower interest income, a byproduct of the $1.63 billion spent on buybacks earlier in the fiscal year, added to the squeeze.
The core insurance business is also cooling. Global insurance units fell 4.2%, with domestic insurance **** ignments down 7.5%, though management noted that figure would have been up 2.3% excluding the loss of a single customer. Collision claim frequency declined 3.4% even as total loss frequency hit a record 23.3% for a second quarter and severity topped $6,300 per claim, up 8.8%. And the ACV deal itself carries integration risk, since management expects only breakeven results before accretion arrives in fiscal 2028.
#quarter #vehicles #insurance
The ACV deal is the headline, and for good reason. ACV brings more than 22,000 active buyers and inspection and valuation technology, while Copart contributes over 275 locations, roughly 4 million vehicles sold annually, and about 1 million members across more than 185 countries. Management structured it as an all-cash tender offer funded from cash on hand, with a close targeted by the end of the calendar year and earnings accretion expected in fiscal 2028. Executives framed the fit as physical scale meeting digital liquidity, giving dealers, banks, and fleet sellers a single partner for disposing of vehicles.
That diversification push is already showing up in the numbers. International revenue grew 11.7% to $222.1 million on 15% service revenue growth, and international buyers accounted for 45.7% of total US sales dollars despite making up only 38.2% of units, a sign they are chasing pricier vehicles. Domestically, non-insurance units returned to growth of 0.2% in the quarter after a full-year decline, dealer units rose 5.8%, and BluCar, which serves banks and fleets, expanded nearly 20%. Global average selling prices climbed 3.5%, evidence that Copart's auctions still command pricing power even as volumes soften.
The quarter's numbers show where the strain is. Consolidated revenue grew 2.4% to $1.2 billion, yet net income dropped 17.4% to $327.4 million and diluted earnings per share fell 14.6% to $0.35. Operating expense per car jumped 12.7% year over year as the company poured money into long-haul delivery, **** leExpress, and dedicated wholesale facilities, and US facility costs alone rose 7.7% in the quarter. Lower interest income, a byproduct of the $1.63 billion spent on buybacks earlier in the fiscal year, added to the squeeze.
The core insurance business is also cooling. Global insurance units fell 4.2%, with domestic insurance **** ignments down 7.5%, though management noted that figure would have been up 2.3% excluding the loss of a single customer. Collision claim frequency declined 3.4% even as total loss frequency hit a record 23.3% for a second quarter and severity topped $6,300 per claim, up 8.8%. And the ACV deal itself carries integration risk, since management expects only breakeven results before accretion arrives in fiscal 2028.
#quarter #vehicles #insurance


17 days ago
On September 10, Lovesac (NASDAQ:LOVE) reported record second quarter revenue of $161.2 million, its highest Q2 total ever, even as its entry-level furniture shopper kept pulling back. The 0.4% sales increase came almost entirely from showrooms rather than higher-margin online orders, and the quarter's real profit boost was traced to a one-time source. A $20 million tariff refund lifted gross margin by 1,200 basis points to 68.4%, masking an underlying business that actually lost money once that windfall is stripped out.
Configurations priced above $6,000 grew by double digits during the quarter, even against a strong comparison from a year earlier, and management pointed to that segment as the clearest sign the brand's value proposition still resonates. Showroom net sales climbed 4.6% to $114.1 million, helped by 14 net new locations opened over the past year and a double-digit jump in conversion rates that offset softer foot traffic.
The Snugg platform, a smaller and more digitally oriented sofa line, helped push "other products" revenue up 198.2%, with more than half of Snugg sales happening online, giving Lovesac a lower-priced entry point into the brand. The Loved by Lovesac resale program is doing similar work, with 70% of its customers new to the company.
Behind all of this sits a pipeline of four major launches set for the second half: a personalized comfort feature for Sactionals, an entirely new large-format premium seating platform, Snugg accessories including a corner piece and swivel base, and the start of onshore Sactionals seat manufacturing, alongside a national rollout of White Glove and Room of Choice delivery. The balance sheet backs it up, with $68.8 million in cash, no debt, $34 million in unused borrowing capacity, and $7.2 million in buybacks with $46.9 million left under the current authorization.
Omni-channel comparable sales fell 1.9%, driven by demand pressure below $6,000, where management said inflation, higher interest rates, and a spike in gas prices have hit the same buyers for several quarters running. Internet sales dropped 5.3%, Sacs sales fell 8.6%, and the exit of the Best Buy shop-in-shop partnership cut "other" net sales by 23.2%. Strip out the tariff refund and adjusted EBITDA was actually a loss of $1.3 million, compared with income of $0.8 million a year earlier, a sign the core business is less profitable than the headline numbers suggest.
#million #quarter #revenue
Configurations priced above $6,000 grew by double digits during the quarter, even against a strong comparison from a year earlier, and management pointed to that segment as the clearest sign the brand's value proposition still resonates. Showroom net sales climbed 4.6% to $114.1 million, helped by 14 net new locations opened over the past year and a double-digit jump in conversion rates that offset softer foot traffic.
The Snugg platform, a smaller and more digitally oriented sofa line, helped push "other products" revenue up 198.2%, with more than half of Snugg sales happening online, giving Lovesac a lower-priced entry point into the brand. The Loved by Lovesac resale program is doing similar work, with 70% of its customers new to the company.
Behind all of this sits a pipeline of four major launches set for the second half: a personalized comfort feature for Sactionals, an entirely new large-format premium seating platform, Snugg accessories including a corner piece and swivel base, and the start of onshore Sactionals seat manufacturing, alongside a national rollout of White Glove and Room of Choice delivery. The balance sheet backs it up, with $68.8 million in cash, no debt, $34 million in unused borrowing capacity, and $7.2 million in buybacks with $46.9 million left under the current authorization.
Omni-channel comparable sales fell 1.9%, driven by demand pressure below $6,000, where management said inflation, higher interest rates, and a spike in gas prices have hit the same buyers for several quarters running. Internet sales dropped 5.3%, Sacs sales fell 8.6%, and the exit of the Best Buy shop-in-shop partnership cut "other" net sales by 23.2%. Strip out the tariff refund and adjusted EBITDA was actually a loss of $1.3 million, compared with income of $0.8 million a year earlier, a sign the core business is less profitable than the headline numbers suggest.
#million #quarter #revenue


17 days ago
ARCC yields nearly 10% with 17 years of stable dividends, while VICI's 7% yield comes with 100% occupancy and 40-year inflation-linked leases.
Pfizer yields 6% at a forward P/E of 10, delivering five straight EPS beats while prioritizing its dividend over buybacks in 2026.
Roth IRA placement turbocharges all four picks since their distributions are taxed as ordinary income in taxable accounts.
Just released. Our ******* ysts combed the entire stock market and named the ten best stocks to buy right now, and Altria didn't make the cut. Enter your email to see the names that beat MO. The report is free. Enter your email and see if any of your stocks made the cut.
Roth IRAs let dividends compound tax-free forever, which makes them the ideal wrapper for names that spit out ordinary-income distributions taxed at your marginal rate outside the account. The four below yield well above the S&P 500 average, and each brings a different flavor of durable cash flow: a business development company, a gaming net-lease REIT, a tobacco cash machine, and a large-cap pharma. As one reference point, Ares Capital (NASDAQ:ARCC) alone reports $1.92 in annualized dividends per share, a payout policy backed by 17 years of stable or increasing regular quarterly dividends.
#dividends #arcc #four
Pfizer yields 6% at a forward P/E of 10, delivering five straight EPS beats while prioritizing its dividend over buybacks in 2026.
Roth IRA placement turbocharges all four picks since their distributions are taxed as ordinary income in taxable accounts.
Just released. Our ******* ysts combed the entire stock market and named the ten best stocks to buy right now, and Altria didn't make the cut. Enter your email to see the names that beat MO. The report is free. Enter your email and see if any of your stocks made the cut.
Roth IRAs let dividends compound tax-free forever, which makes them the ideal wrapper for names that spit out ordinary-income distributions taxed at your marginal rate outside the account. The four below yield well above the S&P 500 average, and each brings a different flavor of durable cash flow: a business development company, a gaming net-lease REIT, a tobacco cash machine, and a large-cap pharma. As one reference point, Ares Capital (NASDAQ:ARCC) alone reports $1.92 in annualized dividends per share, a payout policy backed by 17 years of stable or increasing regular quarterly dividends.
#dividends #arcc #four


18 days ago
Jim Cramer sees Enterprise Products Partners L.P. (NYSE:EPD) as a major beneficiary of the disruption surrounding the Strait of Hormuz, as he said during the September 8 episode of Mad Money:
When I wrote How to Make Money in Any Market… I didn't know that Enterprise Products Partners was going to be the, maybe the single biggest pipeline winner in this country thanks to the war. I didn't see that war coming. The CEO of Enterprise, Jim Teague, has raised awareness for the company's profit opportunity because of the Hormuz closing. The margins of some of its liquids, like ethane to ethylene, ethylene to polyethylene, have soared. As Teague says, the Houston Ship Channel is now just as important as the Strait of Hormuz. Now, there's an endorsement. Stock yields 5.8%.
Enterprise Products Partners L.P. (NYSE:EPD) reported record second-quarter adjusted EBITDA of $2.8 billion, up 17% year over year, while operational distributable cash flow reached a record $2.3 billion, up 21%. Moreover, pipeline volumes reached a record 14.7 million barrels of oil equivalent per day, up 8%, while marine-terminal volumes increased 33% to 2.8 million barrels per day. Co-Chief Executive Officer James Teague said:
Volumes at our marine terminals have returned to normal levels in June and July after the initial rush to backfill volumes affected by hostilities in the Middle East in April and May.
In July, Enterprise Products Partners L.P. (NYSE:EPD) declared a quarterly distribution of $0.56 per unit, or $2.24 annualized, a 2.8% increase from a year earlier. At EPD's September 8 closing price of $38.83, that equates to a yield of approximately 5.8%. The company has increased its distribution for 27 consecutive years. The company's latest investor materials show $6.5 billion of major capital projects under construction. It expects 2026 organic growth capital spending, net of ***** et-sale proceeds, of $2.9 billion to $3.4 billion. The company retained $1.1 billion of DCF for internally funded growth capital expenditures and buybacks.
#partners #hormuz
When I wrote How to Make Money in Any Market… I didn't know that Enterprise Products Partners was going to be the, maybe the single biggest pipeline winner in this country thanks to the war. I didn't see that war coming. The CEO of Enterprise, Jim Teague, has raised awareness for the company's profit opportunity because of the Hormuz closing. The margins of some of its liquids, like ethane to ethylene, ethylene to polyethylene, have soared. As Teague says, the Houston Ship Channel is now just as important as the Strait of Hormuz. Now, there's an endorsement. Stock yields 5.8%.
Enterprise Products Partners L.P. (NYSE:EPD) reported record second-quarter adjusted EBITDA of $2.8 billion, up 17% year over year, while operational distributable cash flow reached a record $2.3 billion, up 21%. Moreover, pipeline volumes reached a record 14.7 million barrels of oil equivalent per day, up 8%, while marine-terminal volumes increased 33% to 2.8 million barrels per day. Co-Chief Executive Officer James Teague said:
Volumes at our marine terminals have returned to normal levels in June and July after the initial rush to backfill volumes affected by hostilities in the Middle East in April and May.
In July, Enterprise Products Partners L.P. (NYSE:EPD) declared a quarterly distribution of $0.56 per unit, or $2.24 annualized, a 2.8% increase from a year earlier. At EPD's September 8 closing price of $38.83, that equates to a yield of approximately 5.8%. The company has increased its distribution for 27 consecutive years. The company's latest investor materials show $6.5 billion of major capital projects under construction. It expects 2026 organic growth capital spending, net of ***** et-sale proceeds, of $2.9 billion to $3.4 billion. The company retained $1.1 billion of DCF for internally funded growth capital expenditures and buybacks.
#partners #hormuz


19 days ago
As continuous inflation squeezes household budgets, the discount retail sector should potentially benefit across the board, with middle- and lower-income consumers looking for value driving foot traffic into value chains. That's roughly what happened in the second-quarter reports from Dollar General Corporation (NYSE:DG) and Dollar Tree, Inc. (NASDAQ:DLTR), both of which were released in late August. Both retailers outperformed expectations, though only one company's stock was rewarded for this.
Dollar General Corporation (NYSE:DG) reported second-quarter results on August 27 that exceeded expectations, and shares rose more than 6.5% in premarket trading. Net sales increased 5.2% to $11.29 billion, surpassing the $11.2 billion market forecast, while diluted EPS came in at $2.48, up 33.3% year-over-year and well above the $2.01 ******* ysts projected. Same-store sales increased 3.5%, driven by a 2.0% increase in customer traffic and a 1.5% increase in average transaction amount, marking the fifth consecutive quarter of traffic growth and the sixth consecutive quarter of positive comps across all four merchandise categories.
Management improved their full-year estimate across the board: same-store sales growth is now expected to be 2.5% to 2.9%, up from 2.2% to 2.7% before, while full-year EPS guidance increased to $7.80-$8.00 from $7.20-$7.45. Tariff refunds, a lower LIFO provision, and improved shrink and damages helped increase the gross margin by 127 basis points to 32.6%. CEO Todd Vasos also pointed to continued market share gains from higher-income households switching away from traditional grocers, a trend the company has cited for several quarters, with management announcing plans to resume up to $700 million in share buybacks in the latter half of the year, backed by remodels under its Project Renovate and Project Elevate initiatives.
Dollar Tree's results, released on August 27, indicate a more complicated situation. Diluted EPS came in at $2.70, including a $1.31-per-share net benefit related to tariff refunds, while revenue increased 7% year-over-year to $4.89 billion. Comparable store sales up 3.7%, driven by a 3.3% gain in average ticket and a 0.4% increase in traffic, a return to positive traffic that occurred a full quarter ahead of management's internal plan.
However, the headline figure includes an important caveat: $1.31 of the $2.70 in EPS came from the net impact of $383 million in IEEPA tariff refunds after related reinvestment spending, duties, and taxes. Strip that out, and underlying EPS was $1.39, above the $1.00-$1.15 range management had guided to in May and about 23% above the $1.13 consensus estimate.
#TRAFFIC
Dollar General Corporation (NYSE:DG) reported second-quarter results on August 27 that exceeded expectations, and shares rose more than 6.5% in premarket trading. Net sales increased 5.2% to $11.29 billion, surpassing the $11.2 billion market forecast, while diluted EPS came in at $2.48, up 33.3% year-over-year and well above the $2.01 ******* ysts projected. Same-store sales increased 3.5%, driven by a 2.0% increase in customer traffic and a 1.5% increase in average transaction amount, marking the fifth consecutive quarter of traffic growth and the sixth consecutive quarter of positive comps across all four merchandise categories.
Management improved their full-year estimate across the board: same-store sales growth is now expected to be 2.5% to 2.9%, up from 2.2% to 2.7% before, while full-year EPS guidance increased to $7.80-$8.00 from $7.20-$7.45. Tariff refunds, a lower LIFO provision, and improved shrink and damages helped increase the gross margin by 127 basis points to 32.6%. CEO Todd Vasos also pointed to continued market share gains from higher-income households switching away from traditional grocers, a trend the company has cited for several quarters, with management announcing plans to resume up to $700 million in share buybacks in the latter half of the year, backed by remodels under its Project Renovate and Project Elevate initiatives.
Dollar Tree's results, released on August 27, indicate a more complicated situation. Diluted EPS came in at $2.70, including a $1.31-per-share net benefit related to tariff refunds, while revenue increased 7% year-over-year to $4.89 billion. Comparable store sales up 3.7%, driven by a 3.3% gain in average ticket and a 0.4% increase in traffic, a return to positive traffic that occurred a full quarter ahead of management's internal plan.
However, the headline figure includes an important caveat: $1.31 of the $2.70 in EPS came from the net impact of $383 million in IEEPA tariff refunds after related reinvestment spending, duties, and taxes. Strip that out, and underlying EPS was $1.39, above the $1.00-$1.15 range management had guided to in May and about 23% above the $1.13 consensus estimate.
#TRAFFIC

20 days ago
Solana (SOL) has been trading relatively range-bound lately, but bulls have managed to defend the $100 psychological threshold ahead of the Federal Reserve's interest rate decision.
The macroeconomic backdrop continues to be challenging for cryptocurrencies, as inflation in the United States is nearly 200 basis points higher than the central bank's target.
Odds of a rate hike in September have now jumped to 62%, up from a recent low of 50%. Meanwhile, the Treasury Department's decision to triple its bond buybacks did little to change the market's cautious attitude.
As a result, the latest crypto rally has stalled, with SOL experiencing a mild 0.7% advance in the past 7 days.
However, an on-chain metric seems to be indicating that a massive price move is about to take place based on historical patterns.
#rate #meanwhile
The macroeconomic backdrop continues to be challenging for cryptocurrencies, as inflation in the United States is nearly 200 basis points higher than the central bank's target.
Odds of a rate hike in September have now jumped to 62%, up from a recent low of 50%. Meanwhile, the Treasury Department's decision to triple its bond buybacks did little to change the market's cautious attitude.
As a result, the latest crypto rally has stalled, with SOL experiencing a mild 0.7% advance in the past 7 days.
However, an on-chain metric seems to be indicating that a massive price move is about to take place based on historical patterns.
#rate #meanwhile


20 days ago
On September 2, Shell Offshore, a subsidiary of Shell plc (NYSE:SHEL), announced the acquisition of a 30% working interest in Conifer, an exploration prospect operated by BP p.l.c. (NYSE:BP) in the U.S. Gulf of Mexico. Located offshore within Keathley Canyon near BP's Kaskida host development, Conifer represents a significant deep-water play. BP retains operatorship, with the initial exploration well expected to spud in 2027. While the deal reflects shared risk and capital efficiency in high-cost offshore basins, comparing the two giants' Q2 2026 earnings shows that Shell is currently executing from a position of superior financial strength.
Shell plc (NYSE:SHEL) delivered an exceptionally clean Q2 2026 report. Adjusted earnings reached $9.8 billion, driven by record upstream production in Brazil and record refinery utilization, which offset Middle East operational outages. Cash flow from operations (CFFO) came in at $21.4 billion, supported by higher realized prices and a $3.4 billion working capital inflow. Shell maintained strict capital discipline, reiterating its full-year capex outlook of $24 billion–$26 billion while completing $5.8 billion in structural cost reductions since 2022. Balance sheet health remains robust, with gearing at 19% and net debt at $42 billion ($12 billion excluding leases).
BP p.l.c. (NYSE:BP) also turned in a solid Q2 recovery, but its headline metrics lag behind Shell's scale. BP reported underlying replacement cost profit (its proxy for net income) of $5.7 billion, a 78% quarter-over-quarter rebound fueled by strong refining margins and oil trading. Operating cash flow reached $10.9 billion after absorbing a $1.0 billion working capital build. BP used strong cash generation to trim net debt down to $22.25 billion, while guiding full-year capex to $13.5 billion–$14.0 billion.
Although BP raised its quarterly dividend by 4% to 8.66 cents, Shell's cash engine allowed it to announce its 19th consecutive quarter of at least $3 billion in share buybacks, distributing 44% of CFFO over the trailing 12 months.
Shell's bull case centers on superior capital allocation, aggressive portfolio high-grading, including the ARC Resources acquisition targeting a 4% production CAGR through 2030, and consistent share buybacks. The bear case focuses on execution risks in integrated gas and LNG amid volatile market conditions, as well as the challenges of integrating large-scale acquisitions.
#cost
Shell plc (NYSE:SHEL) delivered an exceptionally clean Q2 2026 report. Adjusted earnings reached $9.8 billion, driven by record upstream production in Brazil and record refinery utilization, which offset Middle East operational outages. Cash flow from operations (CFFO) came in at $21.4 billion, supported by higher realized prices and a $3.4 billion working capital inflow. Shell maintained strict capital discipline, reiterating its full-year capex outlook of $24 billion–$26 billion while completing $5.8 billion in structural cost reductions since 2022. Balance sheet health remains robust, with gearing at 19% and net debt at $42 billion ($12 billion excluding leases).
BP p.l.c. (NYSE:BP) also turned in a solid Q2 recovery, but its headline metrics lag behind Shell's scale. BP reported underlying replacement cost profit (its proxy for net income) of $5.7 billion, a 78% quarter-over-quarter rebound fueled by strong refining margins and oil trading. Operating cash flow reached $10.9 billion after absorbing a $1.0 billion working capital build. BP used strong cash generation to trim net debt down to $22.25 billion, while guiding full-year capex to $13.5 billion–$14.0 billion.
Although BP raised its quarterly dividend by 4% to 8.66 cents, Shell's cash engine allowed it to announce its 19th consecutive quarter of at least $3 billion in share buybacks, distributing 44% of CFFO over the trailing 12 months.
Shell's bull case centers on superior capital allocation, aggressive portfolio high-grading, including the ARC Resources acquisition targeting a 4% production CAGR through 2030, and consistent share buybacks. The bear case focuses on execution risks in integrated gas and LNG amid volatile market conditions, as well as the challenges of integrating large-scale acquisitions.
#cost

20 days ago
The Treasury Department on Wednesday revealed that it will buy back up as much as $6 billion in longer-dated U.S. debt in an operation this week.
The agency's Bureau of the Fiscal Service announced that it will purchase up to $6 billion in 10-year notes and 20-year bonds in an operation. The securities that will be bought in the operation, which is scheduled to occur from 1:40 p.m. to 2 p.m. ET on Thursday, have maturity dates ranging from February 2037 and August 2046.
The buybacks follow Treasury Secretary Scott Bessent's announcement that Treasury's buyback operations would be at least $4 billion until early November, an increase from the $2 billion that the agency would typically buy back in an operation.
Yields on Treasurys have been elevated in recent years due to stubborn inflation, which has been exacerbated by the Iran war and has caused interest rates to rise further.
Bessent Says Treasury Auctions Will Continue As Usual Despite Expanded Buyback Program
#buyback #back #year #fiscal
The agency's Bureau of the Fiscal Service announced that it will purchase up to $6 billion in 10-year notes and 20-year bonds in an operation. The securities that will be bought in the operation, which is scheduled to occur from 1:40 p.m. to 2 p.m. ET on Thursday, have maturity dates ranging from February 2037 and August 2046.
The buybacks follow Treasury Secretary Scott Bessent's announcement that Treasury's buyback operations would be at least $4 billion until early November, an increase from the $2 billion that the agency would typically buy back in an operation.
Yields on Treasurys have been elevated in recent years due to stubborn inflation, which has been exacerbated by the Iran war and has caused interest rates to rise further.
Bessent Says Treasury Auctions Will Continue As Usual Despite Expanded Buyback Program
#buyback #back #year #fiscal


20 days ago
Warren Buffett spent his final stretch as Berkshire Hathaway's chief executive building the largest corporate cash reserve in American history.
He sold more stock than he bought for 14 consecutive quarters and effectively froze share repurchases across his final six, CNBC reported.
By the time he handed the role to Greg Abel on January 1, 2026, Berkshire's cash pile stood at $373.3 billion, a CNBC interview with Greg confirmed.
Three months into Abel's tenure, that reserve climbed to a record $397.4 billion at the end of the first quarter of 2026, according to Berkshire's 10-Q filing.
Six months into the job, Abel has reversed both positions. Berkshire became a net buyer of equities in the second quarter for the first time in more than three years, with buybacks also surging to $4.5 billion.
#billion #final
He sold more stock than he bought for 14 consecutive quarters and effectively froze share repurchases across his final six, CNBC reported.
By the time he handed the role to Greg Abel on January 1, 2026, Berkshire's cash pile stood at $373.3 billion, a CNBC interview with Greg confirmed.
Three months into Abel's tenure, that reserve climbed to a record $397.4 billion at the end of the first quarter of 2026, according to Berkshire's 10-Q filing.
Six months into the job, Abel has reversed both positions. Berkshire became a net buyer of equities in the second quarter for the first time in more than three years, with buybacks also surging to $4.5 billion.
#billion #final

20 days ago
U.S. Dollar Index is losing some ground as traders focus on Treasury's decision to boost bond buybacks to $6 billion. Bessent continues his attempts to put pressure on yields, but they are rising amid rally in the oil markets. Worries about long-term sustainability of U.S. finances also push yields higher.
The yield of 10-year Treasuries climbed towards the 4.85% level, while the yield of 30-year Treasuries tested the psychologically important 5.30% level.
U.S. Dollar Index continues its attempts to settle below the support level at 98.60 – 98.75. In case U.S. Dollar Index manages to settle below the 98.60 level, it will head towards the next support at 97.70 – 97.85. RSI is in the moderate territory, so there is plenty of room to gain additional downside momentum in the near term.
EUR/USD gained some ground as traders prepared for ECB Interest Rate Decision, which will be released tomorrow. ***** ysts expect that ECB will raise the interest rate from 2.4% to 2.65% due to rising oil prices.
The European Central Bank is forced to raise rates as the EU economy will face inflationary pressure due to high energy prices. It remains to be seen whether winter will be cold, but energy prices will likely stay high anyway.
#dollar #treasuries #interest #rate
The yield of 10-year Treasuries climbed towards the 4.85% level, while the yield of 30-year Treasuries tested the psychologically important 5.30% level.
U.S. Dollar Index continues its attempts to settle below the support level at 98.60 – 98.75. In case U.S. Dollar Index manages to settle below the 98.60 level, it will head towards the next support at 97.70 – 97.85. RSI is in the moderate territory, so there is plenty of room to gain additional downside momentum in the near term.
EUR/USD gained some ground as traders prepared for ECB Interest Rate Decision, which will be released tomorrow. ***** ysts expect that ECB will raise the interest rate from 2.4% to 2.65% due to rising oil prices.
The European Central Bank is forced to raise rates as the EU economy will face inflationary pressure due to high energy prices. It remains to be seen whether winter will be cold, but energy prices will likely stay high anyway.
#dollar #treasuries #interest #rate

23 days ago
On August 5, Primerica (NYSE:PRI) reported second-quarter results that read as two different companies bolted together. Net income climbed 13% to $202 million, and earnings per diluted share jumped 19% to $6.45, pushing return on stockholders' equity to 32.1%. Total revenue reached $865 million, up 9% from a year earlier. But those headline figures obscure a split story. The investment arm is sprinting to record highs while the life insurance sales force is quietly getting smaller. Here is what is actually moving the numbers.
Investment and savings product sales hit a record $4.4 billion in the quarter, up 23% from a year ago, while client ***** et values ended the period at an all-time high of $140 billion, up 16%. Net inflows added another $397 million. That growth translated directly into profit. ISP segment revenue rose 21% to $361 million, and pretax income jumped 31% to $104 million, meaning the segment's margin expanded even as it grew. The reason: ***** et-based commission revenue climbed 28%, outpacing the 19% rise in average client ***** ets, thanks to a shift toward higher-margin US managed accounts and Canadian mutual funds.
Primerica also returned $172 million to shareholders in the quarter through $135 million in buybacks and roughly $37 million in dividends, bringing year-to-date capital returns to $352 million. Its effective tax rate improved to 21.7% from 23.9% a year earlier, and its life insurer's statutory risk-based capital ratio stood at approximately 440%, a cushion most insurers would envy.
The company's distribution engine tells a rougher story. The life-licensed sales force fell 3% year over year to 148,612 representatives. Recruiting rose 2% to 82,346 recruits, but far fewer of them actually got licensed: new life-licensed representatives dropped 15% to 11,020. That gap between recruiting and licensing shows up directly in output. The company issued 78,904 life insurance policies, down 12%, with total face amount issued falling 8% to $27.7 billion.
Term Life revenue was roughly flat at $444 million even as adjusted direct premiums rose 3%, and segment pretax income fell 4% to $148 million. Part of that came from cost creep rather than claims: the benefits and claims ratio held steady at 57.9%, but the insurance expense ratio rose to 8.4% from 7.6% a year earlier, eating into a segment that is supposed to be Primerica's stable, predictable cash generator.
#million #year #rose #sales
Investment and savings product sales hit a record $4.4 billion in the quarter, up 23% from a year ago, while client ***** et values ended the period at an all-time high of $140 billion, up 16%. Net inflows added another $397 million. That growth translated directly into profit. ISP segment revenue rose 21% to $361 million, and pretax income jumped 31% to $104 million, meaning the segment's margin expanded even as it grew. The reason: ***** et-based commission revenue climbed 28%, outpacing the 19% rise in average client ***** ets, thanks to a shift toward higher-margin US managed accounts and Canadian mutual funds.
Primerica also returned $172 million to shareholders in the quarter through $135 million in buybacks and roughly $37 million in dividends, bringing year-to-date capital returns to $352 million. Its effective tax rate improved to 21.7% from 23.9% a year earlier, and its life insurer's statutory risk-based capital ratio stood at approximately 440%, a cushion most insurers would envy.
The company's distribution engine tells a rougher story. The life-licensed sales force fell 3% year over year to 148,612 representatives. Recruiting rose 2% to 82,346 recruits, but far fewer of them actually got licensed: new life-licensed representatives dropped 15% to 11,020. That gap between recruiting and licensing shows up directly in output. The company issued 78,904 life insurance policies, down 12%, with total face amount issued falling 8% to $27.7 billion.
Term Life revenue was roughly flat at $444 million even as adjusted direct premiums rose 3%, and segment pretax income fell 4% to $148 million. Part of that came from cost creep rather than claims: the benefits and claims ratio held steady at 57.9%, but the insurance expense ratio rose to 8.4% from 7.6% a year earlier, eating into a segment that is supposed to be Primerica's stable, predictable cash generator.
#million #year #rose #sales


24 days ago
On August 4, Voya Financial (NYSE:VOYA) announced its second-quarter 2026 results, and the headline numbers tell an uncomfortable story. Net income available to common shareholders dropped to $90 million, or $0.97 per diluted share, down from $162 million and $1.66 a year earlier. Adjusted operating earnings fell just as sharply, to $140 million from $240 million. Yet look past the income statement and Voya's underlying businesses were adding client ******* ets, growing fee income, and returning cash to shareholders at a steady pace.
Voya's Retirement business crossed 10 million participant accounts during the quarter, a milestone that arrived alongside the completed integration of OneAmerica. Total client ******* ets in that segment reached $863 billion as of June 30, up 14% from $757 billion a year earlier, and fee-based revenues climbed 10% year over year. Investment Management told a similar story. Pre-tax adjusted operating earnings there rose 12% to $57 million, helped by $1.2 billion of net inflows during the quarter that pushed ******* ets under management to $377 billion, up from $360 billion a year ago.
Assets under advisory grew even faster, reaching $63 billion from $54 billion. Margins widened too, up 100 basis points on a trailing twelve-month basis to 29.0%. Employee Benefits, often the company's most volatile segment, showed real underwriting progress: the total aggregate loss ratio improved to 74% from 79% a year earlier, lifting its trailing twelve-month margin to 11.0% from just 3.7%. None of that came at the expense of shareholders. Voya generated roughly $150 million of excess capital in the quarter, more than fully converting its adjusted operating earnings into deployable cash, and returned about $200 million through dividends and buybacks, with $263 million still authorized for future repurchases.
The drop in profitability traces to specific, identifiable costs. Corporate reported pre-tax adjusted operating losses of $102 million, up from $67 million a year earlier, largely because of roughly $40 million in severance tied to efficiency actions. A $15 million pre-tax loss on alternative investments added further pressure. Those same alternative investment declines hit Retirement directly: pre-tax adjusted operating earnings there fell to $190 million from $235 million, even as fee revenue grew, because lower alternative investment income and planned strategic investment spending offset the gains. Employee Benefits saw the sharpest swing, with pre-tax adjusted operating earnings falling to $22 million from $69 million.
#year #earnings #assets #voya
Voya's Retirement business crossed 10 million participant accounts during the quarter, a milestone that arrived alongside the completed integration of OneAmerica. Total client ******* ets in that segment reached $863 billion as of June 30, up 14% from $757 billion a year earlier, and fee-based revenues climbed 10% year over year. Investment Management told a similar story. Pre-tax adjusted operating earnings there rose 12% to $57 million, helped by $1.2 billion of net inflows during the quarter that pushed ******* ets under management to $377 billion, up from $360 billion a year ago.
Assets under advisory grew even faster, reaching $63 billion from $54 billion. Margins widened too, up 100 basis points on a trailing twelve-month basis to 29.0%. Employee Benefits, often the company's most volatile segment, showed real underwriting progress: the total aggregate loss ratio improved to 74% from 79% a year earlier, lifting its trailing twelve-month margin to 11.0% from just 3.7%. None of that came at the expense of shareholders. Voya generated roughly $150 million of excess capital in the quarter, more than fully converting its adjusted operating earnings into deployable cash, and returned about $200 million through dividends and buybacks, with $263 million still authorized for future repurchases.
The drop in profitability traces to specific, identifiable costs. Corporate reported pre-tax adjusted operating losses of $102 million, up from $67 million a year earlier, largely because of roughly $40 million in severance tied to efficiency actions. A $15 million pre-tax loss on alternative investments added further pressure. Those same alternative investment declines hit Retirement directly: pre-tax adjusted operating earnings there fell to $190 million from $235 million, even as fee revenue grew, because lower alternative investment income and planned strategic investment spending offset the gains. Employee Benefits saw the sharpest swing, with pre-tax adjusted operating earnings falling to $22 million from $69 million.
#year #earnings #assets #voya

24 days ago
On August 5, OraSure Technologies (NASDAQ:OSUR) reported second-quarter 2026 results that included its first GAAP net income in years, a headline number of $6.2 million versus a $19.7 million loss a year earlier. Revenue of $30.6 million beat the company's own guidance range and climbed 9.7% from the prior quarter. But look past the top line and the story splits in two, one part driven by real operating progress, the other by an accounting adjustment tied to a regulatory setback.
Some of this quarter's improvement came from actual operations. Gross margin expanded to 43.5% on a GAAP basis, up from 42.1% a year earlier, and non-GAAP gross margin rose to 44.2% from 43.2%. Diagnostics revenue grew 1% year over year to $19.4 million, helped by higher syphilis test sales and the addition of BioMedomics' Sickle SCAN product line. OraSure also picked up two regulatory wins during the quarter. In June 2026, the FDA cleared its Colli-Pee Dx urine collection kit for use with Roche's **** ually transmitted infection tests, letting patients collect samples at home instead of in a clinic.
The following month, the FDA granted Emergency Use Authorization for the second-generation OraQuick Ebola 2.0 Rapid Antigen Test, which can detect all four Ebola virus strains known to cause disease in humans. Cash used in operating activities improved to $23.8 million over the first six months of 2026, down from $30 million a year earlier, a sign the cash burn is easing. The company also kept buying back stock, repurchasing $22 million of shares, or 7.7 million shares, against its $40 million authorization, retiring more than 10% of shares outstanding.
The GAAP profit that headlines this quarter didn't come from the business getting more profitable. It came almost entirely from a $22.6 million reduction in a contingent consideration liability, an accounting entry triggered when OraSure updated its regulatory submission plan for the CT/NG test on its Sherlock platform. Strip that adjustment out and the underlying trend looks different. Non-GAAP operating loss widened to $14.7 million from $13.2 million a year earlier, and non-GAAP net loss came in at $13.8 million, roughly in line with last year's $14.2 million loss. The regulatory event behind that accounting gain is itself a setback.
In July, OraSure withdrew its InteliQuick CT/NG molecular self-test submission after receiving FDA feedback, meaning the product's path to market is now delayed while the company prepares a future resubmission. Total revenue for the quarter was still down 2% year over year, and core revenue, which excludes COVID-19 and Risk **** sment Testing, was flat. Six-month revenue fell 4% to $58.6 million. Sample Management Solutions revenue stayed flat year over year at $9.9 million, showing no growth driver of its own. Cash and equivalents fell to $161 million at quarter-end from $199.3 million at the end of 2025, pulled down by continued buybacks and cash used in operations.
#year #gaap #reven
Some of this quarter's improvement came from actual operations. Gross margin expanded to 43.5% on a GAAP basis, up from 42.1% a year earlier, and non-GAAP gross margin rose to 44.2% from 43.2%. Diagnostics revenue grew 1% year over year to $19.4 million, helped by higher syphilis test sales and the addition of BioMedomics' Sickle SCAN product line. OraSure also picked up two regulatory wins during the quarter. In June 2026, the FDA cleared its Colli-Pee Dx urine collection kit for use with Roche's **** ually transmitted infection tests, letting patients collect samples at home instead of in a clinic.
The following month, the FDA granted Emergency Use Authorization for the second-generation OraQuick Ebola 2.0 Rapid Antigen Test, which can detect all four Ebola virus strains known to cause disease in humans. Cash used in operating activities improved to $23.8 million over the first six months of 2026, down from $30 million a year earlier, a sign the cash burn is easing. The company also kept buying back stock, repurchasing $22 million of shares, or 7.7 million shares, against its $40 million authorization, retiring more than 10% of shares outstanding.
The GAAP profit that headlines this quarter didn't come from the business getting more profitable. It came almost entirely from a $22.6 million reduction in a contingent consideration liability, an accounting entry triggered when OraSure updated its regulatory submission plan for the CT/NG test on its Sherlock platform. Strip that adjustment out and the underlying trend looks different. Non-GAAP operating loss widened to $14.7 million from $13.2 million a year earlier, and non-GAAP net loss came in at $13.8 million, roughly in line with last year's $14.2 million loss. The regulatory event behind that accounting gain is itself a setback.
In July, OraSure withdrew its InteliQuick CT/NG molecular self-test submission after receiving FDA feedback, meaning the product's path to market is now delayed while the company prepares a future resubmission. Total revenue for the quarter was still down 2% year over year, and core revenue, which excludes COVID-19 and Risk **** sment Testing, was flat. Six-month revenue fell 4% to $58.6 million. Sample Management Solutions revenue stayed flat year over year at $9.9 million, showing no growth driver of its own. Cash and equivalents fell to $161 million at quarter-end from $199.3 million at the end of 2025, pulled down by continued buybacks and cash used in operations.
#year #gaap #reven


25 days ago
With a total return of 57% over the last three years, the Schwab U.S. Dividend Equity ETF (NYSEMKT: SCHD) has been a boon for income-focused investors who value stability and diversification. Those who already own the fund should probably hold on to it for those two reasons.
That said, no investment exists in a vacuum. And potential new investors have a lot of other options to choose from. Let's dig deeper into the pros and cons of SCHD to decide what the next five years might have in store.
Missed Nvidia in 2009? This Rare Signal Is Flashing Again. In 2009, a "Double Down" signal flashed for a little-known chipmaker called Nvidia. For the first time in years, that same "Total Conviction" signal is flashing for a company 1/100th the size of Nvidia. Continue »
According to research from S&P Global, dividends accounted for a whopping 31% of the S&P 500's total return since 1926, making them a vital part of any long-term investment strategy. This might sound surprising considering blue chip stock yields tend to be relatively small. But these payouts benefit from compounding as they are reinvested into more shares that continue growing and paying more dividends.
And while returning cash directly to investors creates more tax exposure than other strategies like stock buybacks, investors can mitigate the impact by using a tax-advantaged account (such as a Roth IRA). Furthermore, the new cash can be invested in different ****** ets to boost portfolio diversification.
#signal
That said, no investment exists in a vacuum. And potential new investors have a lot of other options to choose from. Let's dig deeper into the pros and cons of SCHD to decide what the next five years might have in store.
Missed Nvidia in 2009? This Rare Signal Is Flashing Again. In 2009, a "Double Down" signal flashed for a little-known chipmaker called Nvidia. For the first time in years, that same "Total Conviction" signal is flashing for a company 1/100th the size of Nvidia. Continue »
According to research from S&P Global, dividends accounted for a whopping 31% of the S&P 500's total return since 1926, making them a vital part of any long-term investment strategy. This might sound surprising considering blue chip stock yields tend to be relatively small. But these payouts benefit from compounding as they are reinvested into more shares that continue growing and paying more dividends.
And while returning cash directly to investors creates more tax exposure than other strategies like stock buybacks, investors can mitigate the impact by using a tax-advantaged account (such as a Roth IRA). Furthermore, the new cash can be invested in different ****** ets to boost portfolio diversification.
#signal

25 days ago
On August 5, Primerica (NYSE:PRI) reported second-quarter results that read as two different companies bolted together. Net income climbed 13% to $202 million, and earnings per diluted share jumped 19% to $6.45, pushing return on stockholders' equity to 32.1%. Total revenue reached $865 million, up 9% from a year earlier. But those headline figures obscure a split story. The investment arm is sprinting to record highs while the life insurance sales force is quietly getting smaller. Here is what is actually moving the numbers.
Investment and savings product sales hit a record $4.4 billion in the quarter, up 23% from a year ago, while client ****** et values ended the period at an all-time high of $140 billion, up 16%. Net inflows added another $397 million. That growth translated directly into profit. ISP segment revenue rose 21% to $361 million, and pretax income jumped 31% to $104 million, meaning the segment's margin expanded even as it grew. The reason: ****** et-based commission revenue climbed 28%, outpacing the 19% rise in average client ****** ets, thanks to a shift toward higher-margin US managed accounts and Canadian mutual funds.
Primerica also returned $172 million to shareholders in the quarter through $135 million in buybacks and roughly $37 million in dividends, bringing year-to-date capital returns to $352 million. Its effective tax rate improved to 21.7% from 23.9% a year earlier, and its life insurer's statutory risk-based capital ratio stood at approximately 440%, a cushion most insurers would envy.
The company's distribution engine tells a rougher story. The life-licensed sales force fell 3% year over year to 148,612 representatives. Recruiting rose 2% to 82,346 recruits, but far fewer of them actually got licensed: new life-licensed representatives dropped 15% to 11,020. That gap between recruiting and licensing shows up directly in output. The company issued 78,904 life insurance policies, down 12%, with total face amount issued falling 8% to $27.7 billion.
Term Life revenue was roughly flat at $444 million even as adjusted direct premiums rose 3%, and segment pretax income fell 4% to $148 million. Part of that came from cost creep rather than claims: the benefits and claims ratio held steady at 57.9%, but the insurance expense ratio rose to 8.4% from 7.6% a year earlier, eating into a segment that is supposed to be Primerica's stable, predictable cash generator.
#sales
Investment and savings product sales hit a record $4.4 billion in the quarter, up 23% from a year ago, while client ****** et values ended the period at an all-time high of $140 billion, up 16%. Net inflows added another $397 million. That growth translated directly into profit. ISP segment revenue rose 21% to $361 million, and pretax income jumped 31% to $104 million, meaning the segment's margin expanded even as it grew. The reason: ****** et-based commission revenue climbed 28%, outpacing the 19% rise in average client ****** ets, thanks to a shift toward higher-margin US managed accounts and Canadian mutual funds.
Primerica also returned $172 million to shareholders in the quarter through $135 million in buybacks and roughly $37 million in dividends, bringing year-to-date capital returns to $352 million. Its effective tax rate improved to 21.7% from 23.9% a year earlier, and its life insurer's statutory risk-based capital ratio stood at approximately 440%, a cushion most insurers would envy.
The company's distribution engine tells a rougher story. The life-licensed sales force fell 3% year over year to 148,612 representatives. Recruiting rose 2% to 82,346 recruits, but far fewer of them actually got licensed: new life-licensed representatives dropped 15% to 11,020. That gap between recruiting and licensing shows up directly in output. The company issued 78,904 life insurance policies, down 12%, with total face amount issued falling 8% to $27.7 billion.
Term Life revenue was roughly flat at $444 million even as adjusted direct premiums rose 3%, and segment pretax income fell 4% to $148 million. Part of that came from cost creep rather than claims: the benefits and claims ratio held steady at 57.9%, but the insurance expense ratio rose to 8.4% from 7.6% a year earlier, eating into a segment that is supposed to be Primerica's stable, predictable cash generator.
#sales


25 days ago
On August 25, EPAM Systems (NYSE:EPAM) announced a partnership with Wiz, the cloud and AI security platform now owned by Google Cloud, joining the Wiz Partner Alliance to help large organizations turn cloud risk data into actual engineering fixes. The timing is notable. Just weeks earlier, on August 6, EPAM reported second-quarter revenue growth of only 4.5% and pointed to a much slower pace ahead. A cybersecurity push gives the company a fresh growth story just as its core business decelerates.
The Wiz deal pairs Wiz's AI Application Protection Platform with EPAM's AI-native engineering and cloud modernization work, aiming to move clients from simply spotting cloud risks to actually remediating them across Google Cloud, AWS, Azure, and other environments. White Hat, an EPAM company, adds an offensive security layer of defensive, offensive, and incident response specialists to test whether flaws found by Wiz are actually exploitable, rather than just theoretical. EPAM says this formalizes work already underway, having delivered Wiz implementation programs across six industries: media and entertainment, transportation and logistics, life sciences and healthcare, financial services, automotive, and retail and consumer goods. That existing footprint gives the partnership a running start rather than a cold launch.
The financial backdrop supports the case that EPAM has room to invest here. Second quarter GAAP income from operations rose to 10.8% of revenue from 9.3% a year earlier, while non-GAAP operating margin climbed to 16.4% from 15%. GAAP diluted EPS reached $1.97, up 26.3% year over year, and non-GAAP diluted EPS hit $3.38, up 22%. The company also returned $409 million to shareholders through buybacks in the first half of 2026, including $85 million in the second quarter alone.
The numbers behind the Wiz announcement tell a more cautious story. EPAM's full-year revenue growth guidance now sits at 3.2% to 4.2%, with organic constant currency growth pegged at just 2.0% to 3.0%. The third quarter outlook is softer still: revenue of $1.410 billion to $1.425 billion implies year-over-year growth of roughly 1.7% at the midpoint, a sharp step down from the 4.5% posted in the second quarter.
Cash flow moved in the wrong direction too. EPAM used $38.8 million in operating activities during the first half of 2026, compared with $77.4 million generated over the same period in 2025. Total cash, equivalents and restricted cash fell 39% to $794.3 million as of June 30, from $1.301 billion at the end of 2025, a decline driven in part by continued share repurchases. Headcount growth was modest as well, with delivery professionals up just 0.3% from the prior quarter, suggesting a company being deliberate rather than aggressive about scaling capacity even as it adds new service lines like Wiz implementation.
#epam #cloud #year #company
The Wiz deal pairs Wiz's AI Application Protection Platform with EPAM's AI-native engineering and cloud modernization work, aiming to move clients from simply spotting cloud risks to actually remediating them across Google Cloud, AWS, Azure, and other environments. White Hat, an EPAM company, adds an offensive security layer of defensive, offensive, and incident response specialists to test whether flaws found by Wiz are actually exploitable, rather than just theoretical. EPAM says this formalizes work already underway, having delivered Wiz implementation programs across six industries: media and entertainment, transportation and logistics, life sciences and healthcare, financial services, automotive, and retail and consumer goods. That existing footprint gives the partnership a running start rather than a cold launch.
The financial backdrop supports the case that EPAM has room to invest here. Second quarter GAAP income from operations rose to 10.8% of revenue from 9.3% a year earlier, while non-GAAP operating margin climbed to 16.4% from 15%. GAAP diluted EPS reached $1.97, up 26.3% year over year, and non-GAAP diluted EPS hit $3.38, up 22%. The company also returned $409 million to shareholders through buybacks in the first half of 2026, including $85 million in the second quarter alone.
The numbers behind the Wiz announcement tell a more cautious story. EPAM's full-year revenue growth guidance now sits at 3.2% to 4.2%, with organic constant currency growth pegged at just 2.0% to 3.0%. The third quarter outlook is softer still: revenue of $1.410 billion to $1.425 billion implies year-over-year growth of roughly 1.7% at the midpoint, a sharp step down from the 4.5% posted in the second quarter.
Cash flow moved in the wrong direction too. EPAM used $38.8 million in operating activities during the first half of 2026, compared with $77.4 million generated over the same period in 2025. Total cash, equivalents and restricted cash fell 39% to $794.3 million as of June 30, from $1.301 billion at the end of 2025, a decline driven in part by continued share repurchases. Headcount growth was modest as well, with delivery professionals up just 0.3% from the prior quarter, suggesting a company being deliberate rather than aggressive about scaling capacity even as it adds new service lines like Wiz implementation.
#epam #cloud #year #company