

2 months ago
Citigroup Inc. (NYSE:C)'s CFO Gonzalo Luchetti said the bank expects return on tangible common equity (RoTCE) to come in slightly above 11% in 2026, while also indicating that Citi will increase stock buybacks from the $13 billion repurchased in 2025. The bank plans to accelerate roughly $500 million of investment by year-end, including spending on severance and marketing intended to expand its credit-card and wealth-management businesses. Citi also expects to remove Banamex from its balance sheet in 2027, which will create an estimated $9 billion currency-translation adjustment loss.
The 11%+ target is meaningful because Citi's profitability has already improved materially. In the second quarter, Citi generated $24.8 billion of revenue, up 14% year over year, while net income rose 45% to $5.8 billion. Investment-banking revenue increased 44% to $1.55 billion, and net interest income increased 13%. Citi's SEC filing shows second-quarter RoTCE of 13.0%, versus 8.7% a year earlier, while the first half of 2026 produced a 13.1% RoTCE. The new guidance therefore suggests management believes profitability can remain above the longer-term 11%-13% RoTCE range Citi established for 2027-28, despite additional investment spending.
Kiev.Victor / Shutterstock.com
The bullish argument is that Citigroup Inc. (NYSE:C) appears to be converting its multiyear restructuring into higher returns while simultaneously returning more capital to shareholders. The move from 8.7% RoTCE in the second quarter of 2025 to 13.0% in the second quarter of 2026 represents a substantial improvement in capital efficiency. Citi's efficiency ratio also improved to 57.4% from 62.7%, indicating that revenue growth is increasingly translating into operating leverage rather than being absorbed by expenses. That is particularly relevant because management now intends to spend another roughly $500 million on severance, marketing, and growth initiatives; if these investments produce the intended expansion in cards and wealth management, they could support revenue growth without derailing the profitability trajectory.
Capital returns provide another positive lever. Citi repurchased $13 billion of stock in 2025 and now expects to increase that amount, while its June 2026 CET1 ratio remained 12.78%, comfortably above its 11.6% standardized regulatory requirement. Buybacks can reduce tangible common equity and shares outstanding, potentially supporting both RoTCE and per-share earnings when executed below intrinsic value. Citi's tangible book value per share had already risen 7% year over year to $100.89 by June 30, 2026. The combination of higher operating profitability, shrinking share count, and improving capital efficiency strengthens the case for a valuation re-rating if Citi can sustain returns above 11%.
#rotce #citi #management
The 11%+ target is meaningful because Citi's profitability has already improved materially. In the second quarter, Citi generated $24.8 billion of revenue, up 14% year over year, while net income rose 45% to $5.8 billion. Investment-banking revenue increased 44% to $1.55 billion, and net interest income increased 13%. Citi's SEC filing shows second-quarter RoTCE of 13.0%, versus 8.7% a year earlier, while the first half of 2026 produced a 13.1% RoTCE. The new guidance therefore suggests management believes profitability can remain above the longer-term 11%-13% RoTCE range Citi established for 2027-28, despite additional investment spending.
Kiev.Victor / Shutterstock.com
The bullish argument is that Citigroup Inc. (NYSE:C) appears to be converting its multiyear restructuring into higher returns while simultaneously returning more capital to shareholders. The move from 8.7% RoTCE in the second quarter of 2025 to 13.0% in the second quarter of 2026 represents a substantial improvement in capital efficiency. Citi's efficiency ratio also improved to 57.4% from 62.7%, indicating that revenue growth is increasingly translating into operating leverage rather than being absorbed by expenses. That is particularly relevant because management now intends to spend another roughly $500 million on severance, marketing, and growth initiatives; if these investments produce the intended expansion in cards and wealth management, they could support revenue growth without derailing the profitability trajectory.
Capital returns provide another positive lever. Citi repurchased $13 billion of stock in 2025 and now expects to increase that amount, while its June 2026 CET1 ratio remained 12.78%, comfortably above its 11.6% standardized regulatory requirement. Buybacks can reduce tangible common equity and shares outstanding, potentially supporting both RoTCE and per-share earnings when executed below intrinsic value. Citi's tangible book value per share had already risen 7% year over year to $100.89 by June 30, 2026. The combination of higher operating profitability, shrinking share count, and improving capital efficiency strengthens the case for a valuation re-rating if Citi can sustain returns above 11%.
#rotce #citi #management


2 months ago
Citigroup Inc. (NYSE:C)'s CFO Gonzalo Luchetti said the bank expects return on tangible common equity (RoTCE) to come in slightly above 11% in 2026, while also indicating that Citi will increase stock buybacks from the $13 billion repurchased in 2025. The bank plans to accelerate roughly $500 million of investment by year-end, including spending on severance and marketing intended to expand its credit-card and wealth-management businesses. Citi also expects to remove Banamex from its balance sheet in 2027, which will create an estimated $9 billion currency-translation adjustment loss.
The 11%+ target is meaningful because Citi's profitability has already improved materially. In the second quarter, Citi generated $24.8 billion of revenue, up 14% year over year, while net income rose 45% to $5.8 billion. Investment-banking revenue increased 44% to $1.55 billion, and net interest income increased 13%. Citi's SEC filing shows second-quarter RoTCE of 13.0%, versus 8.7% a year earlier, while the first half of 2026 produced a 13.1% RoTCE. The new guidance therefore suggests management believes profitability can remain above the longer-term 11%-13% RoTCE range Citi established for 2027-28, despite additional investment spending.
Kiev.Victor / Shutterstock.com
The bullish argument is that Citigroup Inc. (NYSE:C) appears to be converting its multiyear restructuring into higher returns while simultaneously returning more capital to shareholders. The move from 8.7% RoTCE in the second quarter of 2025 to 13.0% in the second quarter of 2026 represents a substantial improvement in capital efficiency. Citi's efficiency ratio also improved to 57.4% from 62.7%, indicating that revenue growth is increasingly translating into operating leverage rather than being absorbed by expenses. That is particularly relevant because management now intends to spend another roughly $500 million on severance, marketing, and growth initiatives; if these investments produce the intended expansion in cards and wealth management, they could support revenue growth without derailing the profitability trajectory.
Capital returns provide another positive lever. Citi repurchased $13 billion of stock in 2025 and now expects to increase that amount, while its June 2026 CET1 ratio remained 12.78%, comfortably above its 11.6% standardized regulatory requirement. Buybacks can reduce tangible common equity and shares outstanding, potentially supporting both RoTCE and per-share earnings when executed below intrinsic value. Citi's tangible book value per share had already risen 7% year over year to $100.89 by June 30, 2026. The combination of higher operating profitability, shrinking share count, and improving capital efficiency strengthens the case for a valuation re-rating if Citi can sustain returns above 11%.
#year #management
The 11%+ target is meaningful because Citi's profitability has already improved materially. In the second quarter, Citi generated $24.8 billion of revenue, up 14% year over year, while net income rose 45% to $5.8 billion. Investment-banking revenue increased 44% to $1.55 billion, and net interest income increased 13%. Citi's SEC filing shows second-quarter RoTCE of 13.0%, versus 8.7% a year earlier, while the first half of 2026 produced a 13.1% RoTCE. The new guidance therefore suggests management believes profitability can remain above the longer-term 11%-13% RoTCE range Citi established for 2027-28, despite additional investment spending.
Kiev.Victor / Shutterstock.com
The bullish argument is that Citigroup Inc. (NYSE:C) appears to be converting its multiyear restructuring into higher returns while simultaneously returning more capital to shareholders. The move from 8.7% RoTCE in the second quarter of 2025 to 13.0% in the second quarter of 2026 represents a substantial improvement in capital efficiency. Citi's efficiency ratio also improved to 57.4% from 62.7%, indicating that revenue growth is increasingly translating into operating leverage rather than being absorbed by expenses. That is particularly relevant because management now intends to spend another roughly $500 million on severance, marketing, and growth initiatives; if these investments produce the intended expansion in cards and wealth management, they could support revenue growth without derailing the profitability trajectory.
Capital returns provide another positive lever. Citi repurchased $13 billion of stock in 2025 and now expects to increase that amount, while its June 2026 CET1 ratio remained 12.78%, comfortably above its 11.6% standardized regulatory requirement. Buybacks can reduce tangible common equity and shares outstanding, potentially supporting both RoTCE and per-share earnings when executed below intrinsic value. Citi's tangible book value per share had already risen 7% year over year to $100.89 by June 30, 2026. The combination of higher operating profitability, shrinking share count, and improving capital efficiency strengthens the case for a valuation re-rating if Citi can sustain returns above 11%.
#year #management


3 months ago
Wall Street just delivered one of its most impressive earnings weeks in history, with the five largest US banks reporting a combined net income of around $49 billion in the second quarter of 2026, up 39% year-over-year, and combined trading revenue close to $39 billion.
Global investment banking income managed to reach $61.4 billion in the first half of the year, a 24% increase over 2025, with **** eX's record-breaking IPO alone accounting for an estimated $500 million in underwriting fees for the banks leading it.
Morgan Stanley (NYSE:MS) came in with arguably the best result of the group. The company achieved an undeniable Q2 earnings beat, achieving record net revenue of $21.35 billion, an 8.6% surprise over the $19.65 billion consensus expectation, marking a 27.1% increase year-over-year and a 4% sequential gain. Diluted earnings per share increased 62.4% year-over-year to $3.46, solidly above Wall Street's $2.92 projection and boosting first-half return on tangible common equity (ROTCE) to an impressive 26.6%. Following the report, Freedom Broker upgraded Morgan Stanley to Buy from Hold on July 17, raising the price objective to $245 from $200.
Meanwhile, equities trading revenue reached an all-time high of $6.3 billion, roughly $1.9 billion higher than **** ysts had predicted, with Morgan Stanley (NYSE:MS) citing general strength across its equities franchise, especially "strength in Asia," a phrase now heard in almost every major bank's earnings call as the AI trade spreads far beyond US markets to Hong Kong, India, **** an, and South Korea.
While turbulent equities trading provided the headlines, Morgan Stanley (NYSE:MS)'s primary competitive advantage is its recurring Wealth and Investment Management franchise, which offers a high-margin buffer against market downturns. Wealth Management earned a record quarterly revenue of $8.9 billion, up 14% year-over-year, with a strong 30.5% pretax margin, driven by higher **** et management fees and net interest income. During the quarter, the company added a record $148 billion in net new **** ets, bringing total client **** ets throughout Wealth and Investment Management above the $10 trillion level.
#billion #NYSE #wealth
Global investment banking income managed to reach $61.4 billion in the first half of the year, a 24% increase over 2025, with **** eX's record-breaking IPO alone accounting for an estimated $500 million in underwriting fees for the banks leading it.
Morgan Stanley (NYSE:MS) came in with arguably the best result of the group. The company achieved an undeniable Q2 earnings beat, achieving record net revenue of $21.35 billion, an 8.6% surprise over the $19.65 billion consensus expectation, marking a 27.1% increase year-over-year and a 4% sequential gain. Diluted earnings per share increased 62.4% year-over-year to $3.46, solidly above Wall Street's $2.92 projection and boosting first-half return on tangible common equity (ROTCE) to an impressive 26.6%. Following the report, Freedom Broker upgraded Morgan Stanley to Buy from Hold on July 17, raising the price objective to $245 from $200.
Meanwhile, equities trading revenue reached an all-time high of $6.3 billion, roughly $1.9 billion higher than **** ysts had predicted, with Morgan Stanley (NYSE:MS) citing general strength across its equities franchise, especially "strength in Asia," a phrase now heard in almost every major bank's earnings call as the AI trade spreads far beyond US markets to Hong Kong, India, **** an, and South Korea.
While turbulent equities trading provided the headlines, Morgan Stanley (NYSE:MS)'s primary competitive advantage is its recurring Wealth and Investment Management franchise, which offers a high-margin buffer against market downturns. Wealth Management earned a record quarterly revenue of $8.9 billion, up 14% year-over-year, with a strong 30.5% pretax margin, driven by higher **** et management fees and net interest income. During the quarter, the company added a record $148 billion in net new **** ets, bringing total client **** ets throughout Wealth and Investment Management above the $10 trillion level.
#billion #NYSE #wealth

3 months ago
Wall Street just delivered one of its most impressive earnings weeks in history, with the five largest US banks reporting a combined net income of around $49 billion in the second quarter of 2026, up 39% year-over-year, and combined trading revenue close to $39 billion.
Global investment banking income managed to reach $61.4 billion in the first half of the year, a 24% increase over 2025, with ******* eX's record-breaking IPO alone accounting for an estimated $500 million in underwriting fees for the banks leading it.
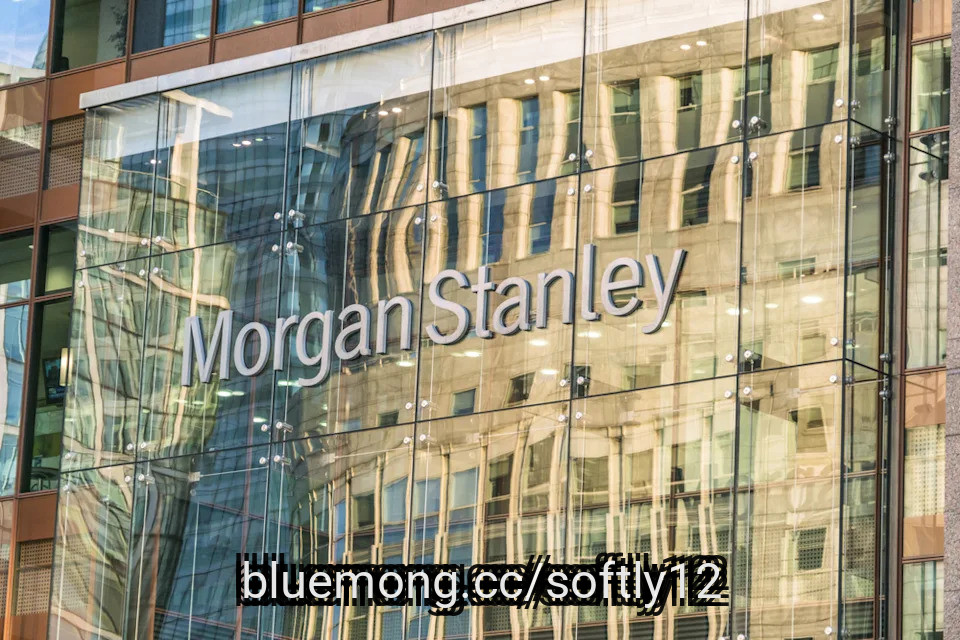
Morgan Stanley (NYSE:MS) came in with arguably the best result of the group. The company achieved an undeniable Q2 earnings beat, achieving record net revenue of $21.35 billion, an 8.6% surprise over the $19.65 billion consensus expectation, marking a 27.1% increase year-over-year and a 4% sequential gain. Diluted earnings per share increased 62.4% year-over-year to $3.46, solidly above Wall Street's $2.92 projection and boosting first-half return on tangible common equity (ROTCE) to an impressive 26.6%. Following the report, Freedom Broker upgraded Morgan Stanley to Buy from Hold on July 17, raising the price objective to $245 from $200.
Meanwhile, equities trading revenue reached an all-time high of $6.3 billion, roughly $1.9 billion higher than ******* ysts had predicted, with Morgan Stanley (NYSE:MS) citing general strength across its equities franchise, especially "strength in Asia," a phrase now heard in almost every major bank's earnings call as the AI trade spreads far beyond US markets to Hong Kong, India, ******* an, and South Korea.
While turbulent equities trading provided the headlines, Morgan Stanley (NYSE:MS)'s primary competitive advantage is its recurring Wealth and Investment Management franchise, which offers a high-margin buffer against market downturns. Wealth Management earned a record quarterly revenue of $8.9 billion, up 14% year-over-year, with a strong 30.5% pretax margin, driven by higher ******* et management fees and net interest income. During the quarter, the company added a record $148 billion in net new ******* ets, bringing total client ******* ets throughout Wealth and Investment Management above the $10 trillion level.
#year #revenue
Global investment banking income managed to reach $61.4 billion in the first half of the year, a 24% increase over 2025, with ******* eX's record-breaking IPO alone accounting for an estimated $500 million in underwriting fees for the banks leading it.
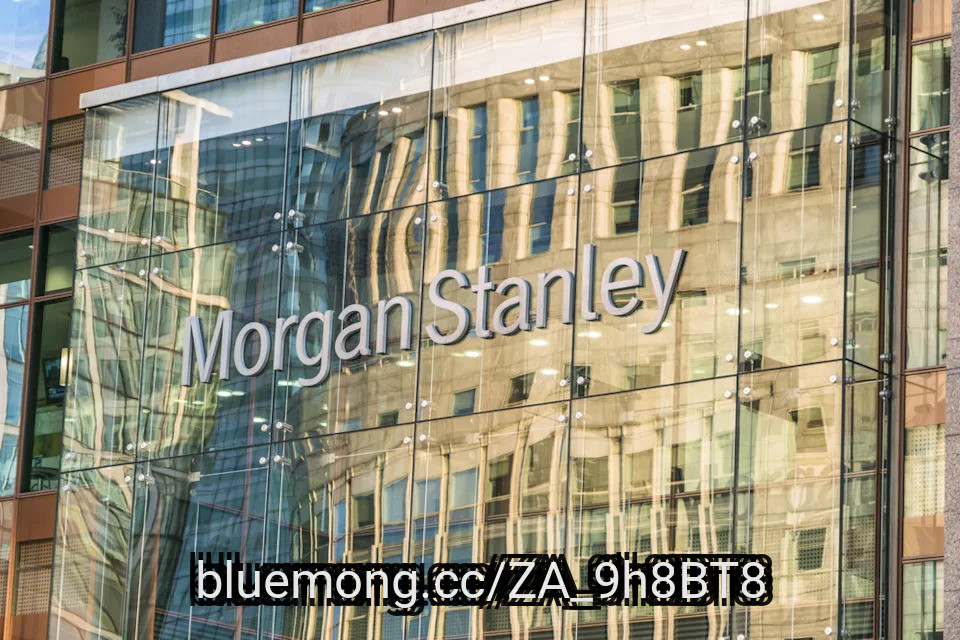
Morgan Stanley (NYSE:MS) came in with arguably the best result of the group. The company achieved an undeniable Q2 earnings beat, achieving record net revenue of $21.35 billion, an 8.6% surprise over the $19.65 billion consensus expectation, marking a 27.1% increase year-over-year and a 4% sequential gain. Diluted earnings per share increased 62.4% year-over-year to $3.46, solidly above Wall Street's $2.92 projection and boosting first-half return on tangible common equity (ROTCE) to an impressive 26.6%. Following the report, Freedom Broker upgraded Morgan Stanley to Buy from Hold on July 17, raising the price objective to $245 from $200.
Meanwhile, equities trading revenue reached an all-time high of $6.3 billion, roughly $1.9 billion higher than ******* ysts had predicted, with Morgan Stanley (NYSE:MS) citing general strength across its equities franchise, especially "strength in Asia," a phrase now heard in almost every major bank's earnings call as the AI trade spreads far beyond US markets to Hong Kong, India, ******* an, and South Korea.
While turbulent equities trading provided the headlines, Morgan Stanley (NYSE:MS)'s primary competitive advantage is its recurring Wealth and Investment Management franchise, which offers a high-margin buffer against market downturns. Wealth Management earned a record quarterly revenue of $8.9 billion, up 14% year-over-year, with a strong 30.5% pretax margin, driven by higher ******* et management fees and net interest income. During the quarter, the company added a record $148 billion in net new ******* ets, bringing total client ******* ets throughout Wealth and Investment Management above the $10 trillion level.
#year #revenue

4 months ago
We just covered the 10 Best Financial Stocks to Buy According to Warren Buffett and Ally Financial Inc. (NYSE:ALLY) ranks 6th on this list.
Ally Financial Inc. (NYSE:ALLY) is a relatively recent addition to the 13F portfolio of Berkshire Hathaway. The fund first disclosed a stake in the company in the first quarter of 2022. Back then, this position comprised just under 9 million shares. By the second quarter of 2022, the fund had increased this holding by over 234%, growing share ownership to 30 million shares. Apart from a minor 3% reduction in the first quarter of 2023, no other buying or selling activity has been registered against this stake since then. Filings for the first quarter of 2026 show that the fund owned 29 million shares in the firm.
In earnings for the first quarter of 2026, Ally Financial Inc. (NYSE:ALLY) posted an adjusted EPS of $1.11, representing a 90% surge year-over-year from $0.58, outpacing Wall Street consensus expectations of $0.94 by more than 18%. The company registered a GAAP net income of $319 million ($0.93 per share), engineering a year-over-year turnaround from the GAAP net loss of $225 million ($0.82 per share) recorded in Q1 2025. Total net revenue jumped 36% year-over-year to $2.10 billion, fueled by surging dealer financial services and elevated yields on new auto loans. Core return on tangible common equity (ROTCE) improved to 11.1%.
While we acknowledge the potential of ALLY as an investment, we believe certain AI stocks offer greater upside potential and carry less downside risk. If you're looking for an extremely undervalued AI stock that also stands to benefit significantly from Trump-era tariffs and the onshoring trend, see our free report on the best short-term AI stock.
READ NEXT: Growth Stock Portfolio: 12 Stock Picks by Carl C. Icahn and Chris Rokos Stock Portfolio: Top 10 Stock Picks.
Ally Financial Inc. (NYSE:ALLY) is a relatively recent addition to the 13F portfolio of Berkshire Hathaway. The fund first disclosed a stake in the company in the first quarter of 2022. Back then, this position comprised just under 9 million shares. By the second quarter of 2022, the fund had increased this holding by over 234%, growing share ownership to 30 million shares. Apart from a minor 3% reduction in the first quarter of 2023, no other buying or selling activity has been registered against this stake since then. Filings for the first quarter of 2026 show that the fund owned 29 million shares in the firm.
In earnings for the first quarter of 2026, Ally Financial Inc. (NYSE:ALLY) posted an adjusted EPS of $1.11, representing a 90% surge year-over-year from $0.58, outpacing Wall Street consensus expectations of $0.94 by more than 18%. The company registered a GAAP net income of $319 million ($0.93 per share), engineering a year-over-year turnaround from the GAAP net loss of $225 million ($0.82 per share) recorded in Q1 2025. Total net revenue jumped 36% year-over-year to $2.10 billion, fueled by surging dealer financial services and elevated yields on new auto loans. Core return on tangible common equity (ROTCE) improved to 11.1%.
While we acknowledge the potential of ALLY as an investment, we believe certain AI stocks offer greater upside potential and carry less downside risk. If you're looking for an extremely undervalued AI stock that also stands to benefit significantly from Trump-era tariffs and the onshoring trend, see our free report on the best short-term AI stock.
READ NEXT: Growth Stock Portfolio: 12 Stock Picks by Carl C. Icahn and Chris Rokos Stock Portfolio: Top 10 Stock Picks.