

7 days ago
Shares of Nvidia Corp (NASDAQ:NVDA) stock are inching 0.4% higher to trade at $211.72 this afternoon, taking a breather after five-straight losing sessions, including yesterday's AI-induced selloff of 3.4%. The equity is still up 13.3% in 2026, however, and a rebound could soon be on the way, per a historically bullish trendline.
According to Schaeffer's Senior Quantitative ***** yst Rocky White, NVDA is trading within 0.75 times the 126-day moving average's 20-day average true range (ATR), after spending at least 80% of the previous two weeks and 80% of the prior 42 trading sessions above that trendline.
This setup has appeared 11 times over the last decade, after which the stock was higher one month later 82% of the time, averaging a 6.2% gain. From its current perch, a move of this caliber would put the equity just shy of $225.
NVDA sports a 50-day put/call volume ratio at the International Securities Exchange (ISE), Cboe Options Exchange (CBOE), and NASDAQ OMX PHLX (PHLX) that stands higher than 83% of readings from the past year. Should this bearish sentiment begin to unwind, it could trigger a new round of tailwinds for the shares.
Options are looking affordable as well. The stock's Schaeffer's Volatility Index (SVI) of 34% stands higher than just 2% of all other readings from the past year. In other words, near-term option traders are pricing in low volatility expectations at the moment.
#NASDAQ #cboe #phlx
According to Schaeffer's Senior Quantitative ***** yst Rocky White, NVDA is trading within 0.75 times the 126-day moving average's 20-day average true range (ATR), after spending at least 80% of the previous two weeks and 80% of the prior 42 trading sessions above that trendline.
This setup has appeared 11 times over the last decade, after which the stock was higher one month later 82% of the time, averaging a 6.2% gain. From its current perch, a move of this caliber would put the equity just shy of $225.
NVDA sports a 50-day put/call volume ratio at the International Securities Exchange (ISE), Cboe Options Exchange (CBOE), and NASDAQ OMX PHLX (PHLX) that stands higher than 83% of readings from the past year. Should this bearish sentiment begin to unwind, it could trigger a new round of tailwinds for the shares.
Options are looking affordable as well. The stock's Schaeffer's Volatility Index (SVI) of 34% stands higher than just 2% of all other readings from the past year. In other words, near-term option traders are pricing in low volatility expectations at the moment.
#NASDAQ #cboe #phlx


13 days ago
VYMI mirrors VYM's rules-based dividend methodology across 1,500 non-US stocks and has outperformed its domestic twin by 11 percentage points over the past year.
VYMI's $22 billion in **** ets is dwarfed by VYM's $83 billion, revealing how overlooked international dividend investing remains despite paying higher yields.
IDV concentrates its international yield hunt into roughly 100 holdings at a 0.50% fee, making it the higher-income, higher-risk alternative to VYMI's diversified approach.
Are you ahead, or behind on retirement? SmartAsset's free tool can match you with a financial advisor in minutes to help you answer that today. Each advisor has been carefully vetted, and must act in your best interests. Don't waste another minute; learn more here.
Ask a typical income investor for a Vanguard dividend ETF, and you'll hear Vanguard High Dividend Yield ETF (NYSEARCA:VYM) before the question is finished. Ask about its overseas sibling, and you'll usually get a blank stare. Vanguard International High Dividend Yield ETF (NASDAQ:VYMI) runs the same playbook outside the United States, pays a fatter distribution, and has quietly outperformed its famous American cousin over the past year. Even the established international name in the category, iShares International Select Dividend ETF (CBOE:IDV), doesn't get much airtime alongside the domestic heavyweights.
#international #vanguard
VYMI's $22 billion in **** ets is dwarfed by VYM's $83 billion, revealing how overlooked international dividend investing remains despite paying higher yields.
IDV concentrates its international yield hunt into roughly 100 holdings at a 0.50% fee, making it the higher-income, higher-risk alternative to VYMI's diversified approach.
Are you ahead, or behind on retirement? SmartAsset's free tool can match you with a financial advisor in minutes to help you answer that today. Each advisor has been carefully vetted, and must act in your best interests. Don't waste another minute; learn more here.
Ask a typical income investor for a Vanguard dividend ETF, and you'll hear Vanguard High Dividend Yield ETF (NYSEARCA:VYM) before the question is finished. Ask about its overseas sibling, and you'll usually get a blank stare. Vanguard International High Dividend Yield ETF (NASDAQ:VYMI) runs the same playbook outside the United States, pays a fatter distribution, and has quietly outperformed its famous American cousin over the past year. Even the established international name in the category, iShares International Select Dividend ETF (CBOE:IDV), doesn't get much airtime alongside the domestic heavyweights.
#international #vanguard


14 days ago
Lyft Inc (NASDAQ:LYFT) is slightly lower this afternoon, down 0.2% at $14.86. Heading for a fifth-straight daily drop, the Uber Technologies (UBER) rival is trading near its late-July lows, sporting a grim 23.3% year-to-date deficit. All may not be lost, however, as this pullback looks to be placing Lyft stock near a trendline with historically bullish implications.
According to Schaeffer's Senior Quantitative ****** yst Rocky White, LYFT shares are within 0.75 of their 126-day moving average's 20-day average true range (ATR), after remaining below it 80% of the time in the past two weeks and in 80% of the last 42 trading sessions.
This signal has occurred five times in the last 10 years, after which Lyft stock was higher one month later 60% of the time, averaging a 9.4% gain. From its current perch, a surge of this magnitude would put the shares back above the $16 area.
Put traders have been circling, per LYFT's 10-day put/call volume ratio at the International Securities Exchange (ISE), Chicago Board Options Exchange (CBOE), and NASDAQ OMX PHLX (PHLX), which stands higher than 76% of all other readings from the past year. Echoing this, the stock's Schaeffer's put/call open interest ratio (SOIR) of ranks higher than all other readings from the past 12 months. Should this bearish sentiment begin to unwind, it could trigger tailwinds for the shares.
Options are attractively priced as well, per the stock's Schaeffer's Volatility Index (SVI) of 51%, which stands higher than just 18% of all other readings from the past year, implying that near-term option traders are pricing in relatively low volatility expectations.
#lyft #higher #uber
According to Schaeffer's Senior Quantitative ****** yst Rocky White, LYFT shares are within 0.75 of their 126-day moving average's 20-day average true range (ATR), after remaining below it 80% of the time in the past two weeks and in 80% of the last 42 trading sessions.
This signal has occurred five times in the last 10 years, after which Lyft stock was higher one month later 60% of the time, averaging a 9.4% gain. From its current perch, a surge of this magnitude would put the shares back above the $16 area.
Put traders have been circling, per LYFT's 10-day put/call volume ratio at the International Securities Exchange (ISE), Chicago Board Options Exchange (CBOE), and NASDAQ OMX PHLX (PHLX), which stands higher than 76% of all other readings from the past year. Echoing this, the stock's Schaeffer's put/call open interest ratio (SOIR) of ranks higher than all other readings from the past 12 months. Should this bearish sentiment begin to unwind, it could trigger tailwinds for the shares.
Options are attractively priced as well, per the stock's Schaeffer's Volatility Index (SVI) of 51%, which stands higher than just 18% of all other readings from the past year, implying that near-term option traders are pricing in relatively low volatility expectations.
#lyft #higher #uber

0.00$ raised of 0.00$ goal
0 donations
0.00$
to go

17 days ago
It is one of the most frustrating puzzles for market participants — and it is happening right now. Stocks feel sluggish, choppy, and unable to make decisive upside progress. Even more significantly, many market leaders are gyrating in price regularly.
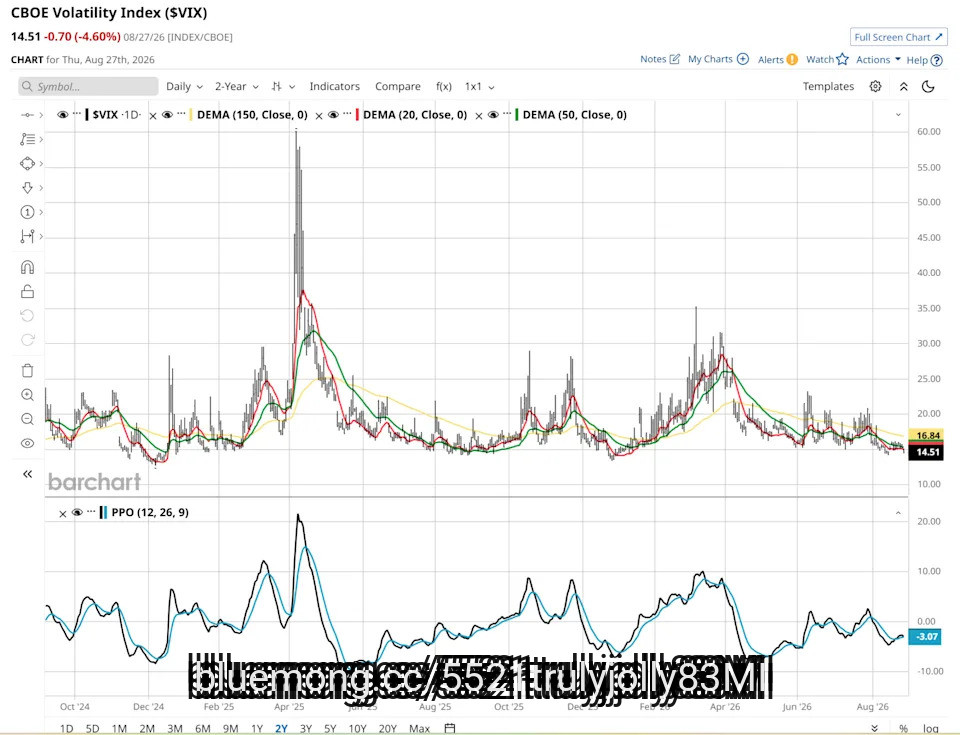
Here's the Invesco QQQ Trust (QQQ) over the past two months. While the market's main fear gauge, the CBOE Volatility Index ($VIX) is tied to the S&P 500 Index ($SPX), QQQ and SPY are more in sync now than ever. So this level of volatility in QQQ should translate to the VIX, at least a little.
How to Play SNPS Stock as Layoffs Hit Synopsys
Micron Stock More Than Tripled in 2026. Now Taiwan Strike Threat Could Shake the AI Boom.
Dear Adobe Stock Fans, Mark Your Calendars for September 10
#volatility #trust
Here's the Invesco QQQ Trust (QQQ) over the past two months. While the market's main fear gauge, the CBOE Volatility Index ($VIX) is tied to the S&P 500 Index ($SPX), QQQ and SPY are more in sync now than ever. So this level of volatility in QQQ should translate to the VIX, at least a little.
How to Play SNPS Stock as Layoffs Hit Synopsys
Micron Stock More Than Tripled in 2026. Now Taiwan Strike Threat Could Shake the AI Boom.
Dear Adobe Stock Fans, Mark Your Calendars for September 10
#volatility #trust

19 days ago
President Donald Trump is proving to be a very challenging commander-in-chief to work around for most investors, even as markets have soared during his tenure. On April 3, 2025, the day after the much-hyped "Liberation Day" barrage of new tariffs, the S&P 500 (SNPINDEX: ^GSPC) fell 4.8% as the Magnificent Seven group of technology companies corrected sharply downward.
Just six trading days later, most of the damage had been erased, leaving investors with whiplash and prompting many to wonder whether they'd sold their **** ets too hastily. Volatility never went away, but it now concentrates in individual stocks rather than the market as a whole. The gap between average single-stock volatility and index volatility hit an all-time high of 31% in early July 2026, according to CBOE Global Markets. Therein lies the crux of why markets are still struggling to get a read on what the president is going to do next.
Missed Nvidia in 2009? This Rare Signal Is Flashing Again. In 2009, a "Double Down" signal flashed for a little-known chipmaker called Nvidia. For the first time in years, that same "Total Conviction" signal is flashing for a company 1/100th the size of Nvidia. Continue »
U.S. tariff policy has changed more than 50 times since January 2025, according to the Tax Foundation. In most of those cases, investors learned about the policy changes via a social media post from the president. The market's moves with each new change have frequently rivaled past stock market crashes in size.
For instance, Nike crashed 14% on April 3, 2025, and Apple declined by 9%. Both crashes were caused by the companies' heavy reliance on supply chains in Asia, which were hit by the new tariffs. Then, on April 9, 2025, Trump waived the initially declared tariff rates for 90 days, causing Apple to bounce by 15.3%. The S&P 500 itself had its best day since 2008.
#NVIDIA #markets #Trump #flashing
Just six trading days later, most of the damage had been erased, leaving investors with whiplash and prompting many to wonder whether they'd sold their **** ets too hastily. Volatility never went away, but it now concentrates in individual stocks rather than the market as a whole. The gap between average single-stock volatility and index volatility hit an all-time high of 31% in early July 2026, according to CBOE Global Markets. Therein lies the crux of why markets are still struggling to get a read on what the president is going to do next.
Missed Nvidia in 2009? This Rare Signal Is Flashing Again. In 2009, a "Double Down" signal flashed for a little-known chipmaker called Nvidia. For the first time in years, that same "Total Conviction" signal is flashing for a company 1/100th the size of Nvidia. Continue »
U.S. tariff policy has changed more than 50 times since January 2025, according to the Tax Foundation. In most of those cases, investors learned about the policy changes via a social media post from the president. The market's moves with each new change have frequently rivaled past stock market crashes in size.
For instance, Nike crashed 14% on April 3, 2025, and Apple declined by 9%. Both crashes were caused by the companies' heavy reliance on supply chains in Asia, which were hit by the new tariffs. Then, on April 9, 2025, Trump waived the initially declared tariff rates for 90 days, causing Apple to bounce by 15.3%. The S&P 500 itself had its best day since 2008.
#NVIDIA #markets #Trump #flashing


19 days ago
Benzinga and Yahoo Finance LLC may earn commission or revenue on some items through the links below.
The U.S. ETF industry is pushing back against the Securities and Exchange Commission's (SEC) broad review of "novel ETFs."
ETF professionals argue an overly wide definition could slow product launches and undermine one of the market's biggest advantages, even as increasingly complex funds test the boundaries of the traditional ETF structure, per a Reuters report.
The SEC opened the review in June after delaying a wave of proposed prediction-market ETFs. Its request covers ETFs that invest in innovative ***** et classes or use unconventional strategies and asks whether existing rules adequately address investor protection, market integrity, and the registration process.
More than 20 industry participants submitted comments around the Aug. 31 deadline, with the docket showing submissions from Charles Schwab, Franklin Templeton, Jane Street, Cboe Global Markets, Grayscale Investments, 21Shares, Andreessen Horowitz and Kalshi.
#industry #finance #securities #june
The U.S. ETF industry is pushing back against the Securities and Exchange Commission's (SEC) broad review of "novel ETFs."
ETF professionals argue an overly wide definition could slow product launches and undermine one of the market's biggest advantages, even as increasingly complex funds test the boundaries of the traditional ETF structure, per a Reuters report.
The SEC opened the review in June after delaying a wave of proposed prediction-market ETFs. Its request covers ETFs that invest in innovative ***** et classes or use unconventional strategies and asks whether existing rules adequately address investor protection, market integrity, and the registration process.
More than 20 industry participants submitted comments around the Aug. 31 deadline, with the docket showing submissions from Charles Schwab, Franklin Templeton, Jane Street, Cboe Global Markets, Grayscale Investments, 21Shares, Andreessen Horowitz and Kalshi.
#industry #finance #securities #june


19 days ago
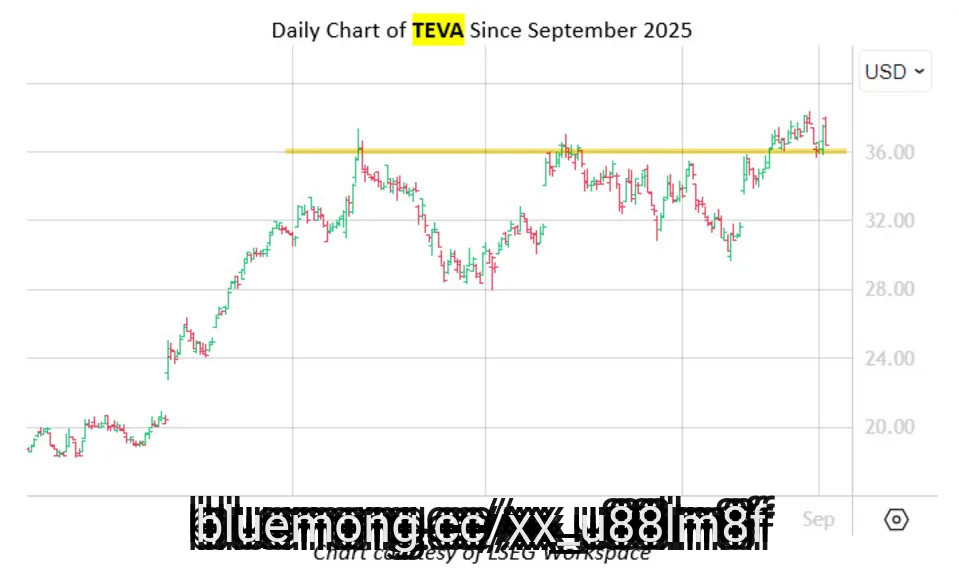
Teva Pharmaceuticals Industries (NYSE:TEVA) is moving 2.9% lower to trade at $36.41, pulling back from its Aug. 27, nearly nine-year high of $38.36. The $36 level looks to have moved in as a floor of support, a former level of resistance for the shares since late January. More gains could be on the table, however, with a fresh bull signal now flashing for the drug maker.
TEVA's long-term outperformance comes amid historically low implied volatility (IV). Specifically, the equity's current SVI of 29% stands in the low 5th percentile of its annual range.
According to data from Schaeffer's Senior Quantitative ******* yst Rocky White, there have been five instances in the past five years when the equity traded within 2% of its 52-week high, while its Schaeffer's Volatility Index (SVI) ranked in the 20th percentile of its annual range or lower.
TEVA was higher one month later 80% of the time after those signals, averaging a 5.5% gain. From its current perch, a shift of this amount would put the equity back above $38 -- within a chip-shot of its August peak.
Options traders are still not convinced. This is per the equity's 10-day put/call volume ratio at the International Securities Exchange (ISE), Cboe Options Exchange (CBOE), and NASDAQ OMX PHLX (PHLX), which sits higher than 96% of readings from the past year. Should this bearish sentiment begin to unwind, it could trigger more tailwinds for the shares.
#exchange
TEVA's long-term outperformance comes amid historically low implied volatility (IV). Specifically, the equity's current SVI of 29% stands in the low 5th percentile of its annual range.
According to data from Schaeffer's Senior Quantitative ******* yst Rocky White, there have been five instances in the past five years when the equity traded within 2% of its 52-week high, while its Schaeffer's Volatility Index (SVI) ranked in the 20th percentile of its annual range or lower.
TEVA was higher one month later 80% of the time after those signals, averaging a 5.5% gain. From its current perch, a shift of this amount would put the equity back above $38 -- within a chip-shot of its August peak.
Options traders are still not convinced. This is per the equity's 10-day put/call volume ratio at the International Securities Exchange (ISE), Cboe Options Exchange (CBOE), and NASDAQ OMX PHLX (PHLX), which sits higher than 96% of readings from the past year. Should this bearish sentiment begin to unwind, it could trigger more tailwinds for the shares.
#exchange

20 days ago
Offerpad surged 7% and Opendoor rose 2% as falling Treasury yields eased both mortgage market conditions and their inventory financing costs simultaneously.
ITB gained just 0.7% on the same rate news because builders control their own supply and carry none of the balance-sheet leverage that amplifies iBuyer moves.
Just released. Our ******* ysts combed the entire stock market and named the ten best stocks to buy right now. The report is free. Enter your email and see if any of your stocks made the cut.
The most rate-sensitive corner of housing is doing the day's work while homebuilders barely move. The iShares U.S. Home Construction ETF (CBOE:ITB) is up 0.7% to $92.96 in midday trading, a soft bid for the group that controls its own supply. The 10-year Treasury note yield sits at 4.8% and is nearly unchanged over the past 24 hours.
Offerpad Solutions (NYSE:OPAD) stock is up 7% to $4.40. Meanwhile, Opendoor Technologies (NASDAQ:OPEN) stock is rising 2% to $3.09, a same-direction but shallower move in the sector's other listed iBuyer.
#Stock #opendoor #ibuyer
ITB gained just 0.7% on the same rate news because builders control their own supply and carry none of the balance-sheet leverage that amplifies iBuyer moves.
Just released. Our ******* ysts combed the entire stock market and named the ten best stocks to buy right now. The report is free. Enter your email and see if any of your stocks made the cut.
The most rate-sensitive corner of housing is doing the day's work while homebuilders barely move. The iShares U.S. Home Construction ETF (CBOE:ITB) is up 0.7% to $92.96 in midday trading, a soft bid for the group that controls its own supply. The 10-year Treasury note yield sits at 4.8% and is nearly unchanged over the past 24 hours.
Offerpad Solutions (NYSE:OPAD) stock is up 7% to $4.40. Meanwhile, Opendoor Technologies (NASDAQ:OPEN) stock is rising 2% to $3.09, a same-direction but shallower move in the sector's other listed iBuyer.
#Stock #opendoor #ibuyer


21 days ago
As September gets underway, we want to help you stay ahead of the game with our monthly list of stocks to buy and avoid. We've hit the best Dow stock to own in September, but below we're going to take a look at where you might want to avoid putting your money in what historically tends to be the worst trading month of the year.
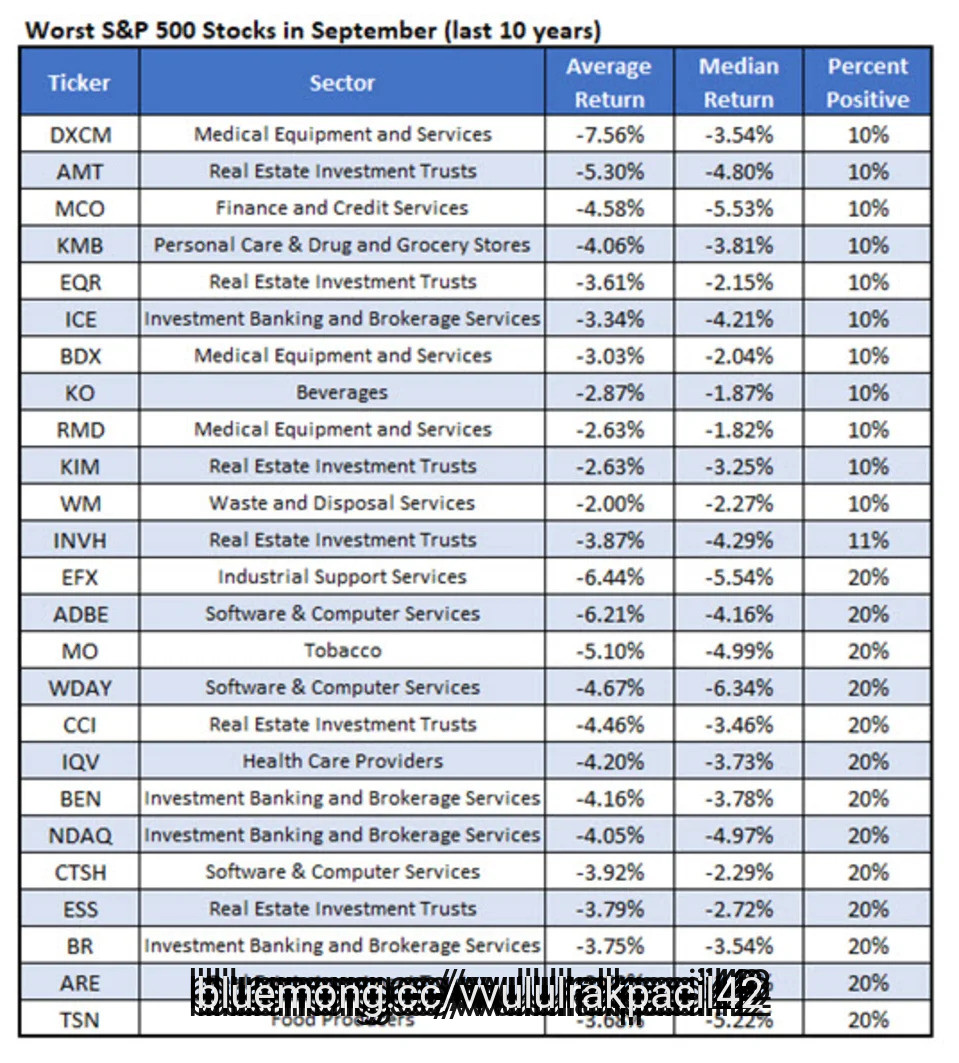
Below is a list of the 25 worst-performing S&P 500 stocks in September over the last 10 years, per data from Schaeffer's Senior Quantitative ******* yst Rocky White. Among the historical underperformers is Adobe Inc (NASDAQ:ADBE).
According White's data, ADBE averaged a loss of 6.2% over the last 10 years, and has finished higher only twice. From its current perch, a pullback of this magnitude could put the software name back near $271. The stock is already living up to the data, down 1.6% to trade at $288.04 at last check today and looking to snap a three-day win streak.
The stock's recent rebound appears to be losing steam at the $300 level, while long-term pressure at the descending 320-day moving average lingers above as well. Year to date, ADBE is down 17.7%.
Options traders are still buying into the hype, however. This is per the equity's 50-day call/put volume ratio of 2.21 over at the International Securities Exchange (ISE), Cboe Options Exchange (CBOE), and NASDAQ OMX PHLX (PHLX), which sits higher than 82% of readings from the past year. Should this bullish sentiment begin to unwind, it could trigger more headwinds for the shares.
#september #exchange #phlx
Below is a list of the 25 worst-performing S&P 500 stocks in September over the last 10 years, per data from Schaeffer's Senior Quantitative ******* yst Rocky White. Among the historical underperformers is Adobe Inc (NASDAQ:ADBE).
According White's data, ADBE averaged a loss of 6.2% over the last 10 years, and has finished higher only twice. From its current perch, a pullback of this magnitude could put the software name back near $271. The stock is already living up to the data, down 1.6% to trade at $288.04 at last check today and looking to snap a three-day win streak.
The stock's recent rebound appears to be losing steam at the $300 level, while long-term pressure at the descending 320-day moving average lingers above as well. Year to date, ADBE is down 17.7%.
Options traders are still buying into the hype, however. This is per the equity's 50-day call/put volume ratio of 2.21 over at the International Securities Exchange (ISE), Cboe Options Exchange (CBOE), and NASDAQ OMX PHLX (PHLX), which sits higher than 82% of readings from the past year. Should this bullish sentiment begin to unwind, it could trigger more headwinds for the shares.
#september #exchange #phlx

22 days ago
TSLW's 29% price drop looks worse than TSLA's 22% YTD loss, but trailing distributions of nearly $18 per share account for most of the gap.
Only 20% of TSLW is actual Tesla stock; 67% sits in Treasury bill collateral and 12% in derivatives that generate the weekly option income.
Read More: Learn 7 ways to generate income with a $1,000,000+ portfolio (sponsor)
If you bought Roundhill Tesla WeeklyPay ETF (CBOE:TSLW) for the paychecks, the paychecks arrived. A distribution hit your account almost every Friday in 2026, most recently $0.183637 per share paid on August 25. Then you looked at the price chart. TSLW opened the year at $24.82 and closed August 28 at $17.56, a price return of negative 29.26%. Something is missing from that picture.
TSLW is a weekly income vehicle wrapped around Tesla exposure. Distributions are paid out of net ****** et value on each ex-date. That mechanical drop is baked into the price line you see. That drop reflects cash that left the fund and, in theory, landed in your brokerage account, separate from any expense ratio or fund-inflicted loss.
#august
Only 20% of TSLW is actual Tesla stock; 67% sits in Treasury bill collateral and 12% in derivatives that generate the weekly option income.
Read More: Learn 7 ways to generate income with a $1,000,000+ portfolio (sponsor)
If you bought Roundhill Tesla WeeklyPay ETF (CBOE:TSLW) for the paychecks, the paychecks arrived. A distribution hit your account almost every Friday in 2026, most recently $0.183637 per share paid on August 25. Then you looked at the price chart. TSLW opened the year at $24.82 and closed August 28 at $17.56, a price return of negative 29.26%. Something is missing from that picture.
TSLW is a weekly income vehicle wrapped around Tesla exposure. Distributions are paid out of net ****** et value on each ex-date. That mechanical drop is baked into the price line you see. That drop reflects cash that left the fund and, in theory, landed in your brokerage account, separate from any expense ratio or fund-inflicted loss.
#august
27 days ago
Large-cap value is beating the broader market in 2026, but VTV, COWZ, and DHS capture the rotation differently. VTV offers broad traditional value exposure, COWZ targets companies with high free-cash-flow yields, and DHS emphasizes high-dividend stocks.
COWZ offers the strongest quality-oriented value tilt. Its free-cash-flow methodology has helped it outperform while avoiding some weaknesses of traditional valuation screens, although investors pay a higher 0.49% expense ratio.
VTV and DHS fill clearer portfolio roles. VTV is the ultra-low-cost core option at 0.03%, while DHS offers the highest income focus with monthly distributions and a yield around 3%.
Read More: Learn 7 secret wealth tips high net worth investors use that most investors miss (sponsor)
Large-cap value has quietly outrun the broader market in 2026, and three exchange-traded funds capture that shift while paying meaningful dividends: the Vanguard Value ETF (NYSEARCA:VTV), the Pacer US Cash Cows 100 ETF (CBOE:COWZ), and the WisdomTree U.S. High Dividend Fund (NYSEARCA:DHS). Each is beating the S&P 500 year to date, but each defines "value" differently, which matters more than the shared headline.
#cowz #investors
COWZ offers the strongest quality-oriented value tilt. Its free-cash-flow methodology has helped it outperform while avoiding some weaknesses of traditional valuation screens, although investors pay a higher 0.49% expense ratio.
VTV and DHS fill clearer portfolio roles. VTV is the ultra-low-cost core option at 0.03%, while DHS offers the highest income focus with monthly distributions and a yield around 3%.
Read More: Learn 7 secret wealth tips high net worth investors use that most investors miss (sponsor)
Large-cap value has quietly outrun the broader market in 2026, and three exchange-traded funds capture that shift while paying meaningful dividends: the Vanguard Value ETF (NYSEARCA:VTV), the Pacer US Cash Cows 100 ETF (CBOE:COWZ), and the WisdomTree U.S. High Dividend Fund (NYSEARCA:DHS). Each is beating the S&P 500 year to date, but each defines "value" differently, which matters more than the shared headline.
#cowz #investors


28 days ago
Salesforce surged 10%, snapping a months-long slump, as Agentforce ARR hit nearly $3.9 billion and the Anthropic-built Claudeforce plugin launched with 37 prebuilt sales skills.
IGV jumped 3% against QQQ's 0.8% gain while Palantir slipped 0.2%, confirming a rotation into enterprise CRM software over pure-play AI names.
Non-GAAP EPS only matched consensus and GAAP net income leaned on a $2.6 billion Anthropic investment gain rather than pure operating results.
Read More: Learn 7 secret wealth tips high net worth investors use that most investors miss (sponsor)
Enterprise software is leading Thursday morning after Salesforce's fiscal Q2 2027 beat and Claudeforce announcement reset the sector's AI narrative. The iShares Expanded Tech-Software Sector ETF (CBOE:IGV) is up 3% to $105.19 this morning. At the same time, the Invesco QQQ Trust (NASDAQ:QQQ) is up 0.8% to $717.44, a clear tell that today's strength is centered inside software rather than broad large-cap technology.
#software #enterprise #rather #investors
IGV jumped 3% against QQQ's 0.8% gain while Palantir slipped 0.2%, confirming a rotation into enterprise CRM software over pure-play AI names.
Non-GAAP EPS only matched consensus and GAAP net income leaned on a $2.6 billion Anthropic investment gain rather than pure operating results.
Read More: Learn 7 secret wealth tips high net worth investors use that most investors miss (sponsor)
Enterprise software is leading Thursday morning after Salesforce's fiscal Q2 2027 beat and Claudeforce announcement reset the sector's AI narrative. The iShares Expanded Tech-Software Sector ETF (CBOE:IGV) is up 3% to $105.19 this morning. At the same time, the Invesco QQQ Trust (NASDAQ:QQQ) is up 0.8% to $717.44, a clear tell that today's strength is centered inside software rather than broad large-cap technology.
#software #enterprise #rather #investors



1 month ago
Some offers on this page are from advertisers who pay us, which may affect which products we write about, but not our recommendations. See our Advertiser Disclosure.
Gold (GC=F) December futures opened at $4,391.40 per troy ounce on Wednesday, August 19, 2026, down 0.7% from Tuesday's closing price. The price of gold is up this morning at $4,479.90 per troy ounce as of 8:53 a.m. ET.
Gold opened lower Wednesday morning but rose in early trading as the U.S. dollar and Treasury yields pulled back slightly. The U.S. Dollar Index (DX-Y.NYB) was down 0.2%, while the benchmark CBOE Interest Rate 10 Year T No (^TNX) declined 0.4%. The 10-year yield still remains near its 12-month high, achieved on July 31.
Weakness in the U.S. dollar precedes the release of the FOMC's minutes from the July meeting. Investors will evaluate the minutes for hints on the Fed's short-term outlook for interest rates. That outlook is complicated by the ongoing conflict in the Middle East driving inflation risk, coupled with recent softness in retail sales.
CME FedWatch estimates a 67.4% probability that the Fed will not change interest rates at the September meeting. A rate increase pressures the gold price by making yield-bearing **** ets look more attractive in comparison. The opposite is also true. Gold has gained more than 10% over the last three weeks as rate-hike expectations have declined.
#price
Gold (GC=F) December futures opened at $4,391.40 per troy ounce on Wednesday, August 19, 2026, down 0.7% from Tuesday's closing price. The price of gold is up this morning at $4,479.90 per troy ounce as of 8:53 a.m. ET.
Gold opened lower Wednesday morning but rose in early trading as the U.S. dollar and Treasury yields pulled back slightly. The U.S. Dollar Index (DX-Y.NYB) was down 0.2%, while the benchmark CBOE Interest Rate 10 Year T No (^TNX) declined 0.4%. The 10-year yield still remains near its 12-month high, achieved on July 31.
Weakness in the U.S. dollar precedes the release of the FOMC's minutes from the July meeting. Investors will evaluate the minutes for hints on the Fed's short-term outlook for interest rates. That outlook is complicated by the ongoing conflict in the Middle East driving inflation risk, coupled with recent softness in retail sales.
CME FedWatch estimates a 67.4% probability that the Fed will not change interest rates at the September meeting. A rate increase pressures the gold price by making yield-bearing **** ets look more attractive in comparison. The opposite is also true. Gold has gained more than 10% over the last three weeks as rate-hike expectations have declined.
#price



1 month ago
Some offers on this page are from advertisers who pay us, which may affect which products we write about, but not our recommendations. See our Advertiser Disclosure.
Gold (GC=F) December futures opened at $4,391.40 per troy ounce on Wednesday, August 19, 2026, down 0.7% from Tuesday's closing price. The price of gold is up this morning at $4,479.90 per troy ounce as of 8:53 a.m. ET.
Gold opened lower Wednesday morning but rose in early trading as the U.S. dollar and Treasury yields pulled back slightly. The U.S. Dollar Index (DX-Y.NYB) was down 0.2%, while the benchmark CBOE Interest Rate 10 Year T No (^TNX) declined 0.4%. The 10-year yield still remains near its 12-month high, achieved on July 31.
Weakness in the U.S. dollar precedes the release of the FOMC's minutes from the July meeting. Investors will evaluate the minutes for hints on the Fed's short-term outlook for interest rates. That outlook is complicated by the ongoing conflict in the Middle East driving inflation risk, coupled with recent softness in retail sales.
CME FedWatch estimates a 67.4% probability that the Fed will not change interest rates at the September meeting. A rate increase pressures the gold price by making yield-bearing ***** ets look more attractive in comparison. The opposite is also true. Gold has gained more than 10% over the last three weeks as rate-hike expectations have declined.
#rate #year
Gold (GC=F) December futures opened at $4,391.40 per troy ounce on Wednesday, August 19, 2026, down 0.7% from Tuesday's closing price. The price of gold is up this morning at $4,479.90 per troy ounce as of 8:53 a.m. ET.
Gold opened lower Wednesday morning but rose in early trading as the U.S. dollar and Treasury yields pulled back slightly. The U.S. Dollar Index (DX-Y.NYB) was down 0.2%, while the benchmark CBOE Interest Rate 10 Year T No (^TNX) declined 0.4%. The 10-year yield still remains near its 12-month high, achieved on July 31.
Weakness in the U.S. dollar precedes the release of the FOMC's minutes from the July meeting. Investors will evaluate the minutes for hints on the Fed's short-term outlook for interest rates. That outlook is complicated by the ongoing conflict in the Middle East driving inflation risk, coupled with recent softness in retail sales.
CME FedWatch estimates a 67.4% probability that the Fed will not change interest rates at the September meeting. A rate increase pressures the gold price by making yield-bearing ***** ets look more attractive in comparison. The opposite is also true. Gold has gained more than 10% over the last three weeks as rate-hike expectations have declined.
#rate #year



1 month ago
Some offers on this page are from advertisers who pay us, which may affect which products we write about, but not our recommendations. See our Advertiser Disclosure.
Gold (GC=F) December futures opened at $4,391.40 per troy ounce on Wednesday, August 19, 2026, down 0.7% from Tuesday's closing price. The price of gold is up this morning at $4,479.90 per troy ounce as of 8:53 a.m. ET.
Gold opened lower Wednesday morning but rose in early trading as the U.S. dollar and Treasury yields pulled back slightly. The U.S. Dollar Index (DX-Y.NYB) was down 0.2%, while the benchmark CBOE Interest Rate 10 Year T No (^TNX) declined 0.4%. The 10-year yield still remains near its 12-month high, achieved on July 31.
Weakness in the U.S. dollar precedes the release of the FOMC's minutes from the July meeting. Investors will evaluate the minutes for hints on the Fed's short-term outlook for interest rates. That outlook is complicated by the ongoing conflict in the Middle East driving inflation risk, coupled with recent softness in retail sales.
CME FedWatch estimates a 67.4% probability that the Fed will not change interest rates at the September meeting. A rate increase pressures the gold price by making yield-bearing ****** ets look more attractive in comparison. The opposite is also true. Gold has gained more than 10% over the last three weeks as rate-hike expectations have declined.
#Gold #rate #july #opened
Gold (GC=F) December futures opened at $4,391.40 per troy ounce on Wednesday, August 19, 2026, down 0.7% from Tuesday's closing price. The price of gold is up this morning at $4,479.90 per troy ounce as of 8:53 a.m. ET.
Gold opened lower Wednesday morning but rose in early trading as the U.S. dollar and Treasury yields pulled back slightly. The U.S. Dollar Index (DX-Y.NYB) was down 0.2%, while the benchmark CBOE Interest Rate 10 Year T No (^TNX) declined 0.4%. The 10-year yield still remains near its 12-month high, achieved on July 31.
Weakness in the U.S. dollar precedes the release of the FOMC's minutes from the July meeting. Investors will evaluate the minutes for hints on the Fed's short-term outlook for interest rates. That outlook is complicated by the ongoing conflict in the Middle East driving inflation risk, coupled with recent softness in retail sales.
CME FedWatch estimates a 67.4% probability that the Fed will not change interest rates at the September meeting. A rate increase pressures the gold price by making yield-bearing ****** ets look more attractive in comparison. The opposite is also true. Gold has gained more than 10% over the last three weeks as rate-hike expectations have declined.
#Gold #rate #july #opened



1 month ago
The S&P 500 Index (SPX) is trading near all-time highs, which is nothing new over the past several years. But there has been a sudden interest in hedging against a volatility spike. That's evident in the 10-day buy-to-open (BTO) call/put ratio for Cboe Market Volatility Index (VIX) options. A spike in VIX call buying has pushed the ratio above 6.0, which has been reached just a handful of times since 2025.
The VIX measures the expected volatility of the SPX over the next 30 days. Since the VIX tends to rise when the SPX falls, portfolio managers often use VIX calls to hedge against a sharp market downturn.
There's a contrarian argument, however, that if investors are hedged against a selloff, they may be less likely to panic sell, minimizing the likelihood of a sharp pullback. An alternative theory is that VIX option buyers are more sophisticated traders, and the unusual spike in call buying could be smart money. If so, SPX underperformance over the short- to medium-term wouldn't be surprising. Instead of taking a side, I'm examining the historical data to see which theory holds up.
The table below shows how the SPX performed after the VIX 10-Day BTO Call/Put Ratio spiked above 6.0. I only counted the first spike in at least a month. The second table shows typical index returns for comparison, while the overall results show a clear theory winner. VIX option traders have historically appeared as smart money investors rather than overly cautious investors. The SPX significantly underperformed after previous spikes in the ratio.
Since 2014, there have been 31 instances when the VIX BTO call/put ratio spiked above 6.0. Over the following two weeks, the SPX averaged a loss of 0.60%, with only 45% of returns positive. For comparison, the index typically gained 0.50% over two-week periods with 64% of returns positive. In the three months following a spike, the SPX lost 0.65% on average with 60% of returns positive, versus a typical three-month gain of 3.11% and 75% positive.
#above
The VIX measures the expected volatility of the SPX over the next 30 days. Since the VIX tends to rise when the SPX falls, portfolio managers often use VIX calls to hedge against a sharp market downturn.
There's a contrarian argument, however, that if investors are hedged against a selloff, they may be less likely to panic sell, minimizing the likelihood of a sharp pullback. An alternative theory is that VIX option buyers are more sophisticated traders, and the unusual spike in call buying could be smart money. If so, SPX underperformance over the short- to medium-term wouldn't be surprising. Instead of taking a side, I'm examining the historical data to see which theory holds up.
The table below shows how the SPX performed after the VIX 10-Day BTO Call/Put Ratio spiked above 6.0. I only counted the first spike in at least a month. The second table shows typical index returns for comparison, while the overall results show a clear theory winner. VIX option traders have historically appeared as smart money investors rather than overly cautious investors. The SPX significantly underperformed after previous spikes in the ratio.
Since 2014, there have been 31 instances when the VIX BTO call/put ratio spiked above 6.0. Over the following two weeks, the SPX averaged a loss of 0.60%, with only 45% of returns positive. For comparison, the index typically gained 0.50% over two-week periods with 64% of returns positive. In the three months following a spike, the SPX lost 0.65% on average with 60% of returns positive, versus a typical three-month gain of 3.11% and 75% positive.
#above



1 month ago
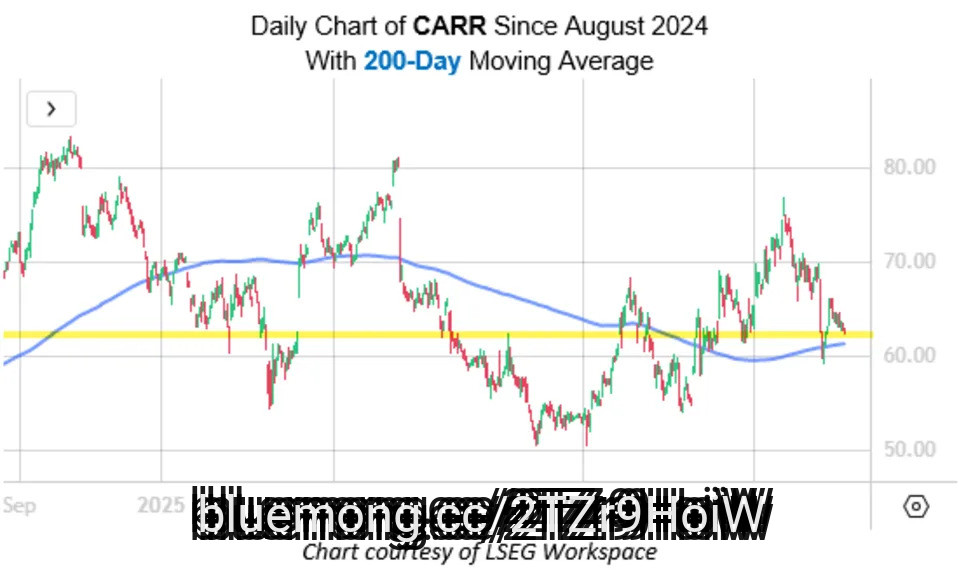
Climate and energy solutions stock Carrier Global Corporation (NYSE:CARR) has taken a breather since its June 25 nearly 52-week high of $76.76, last seen flat at $62.73 today. The underlying $62.50 level has been a key level of support and resistance, however, while the shares are also nearing a trendline with historically bullish implications.
According to Schaeffer's Senior Quantitative **** yst Rocky White, CARR is trading within 0.75 times the 200-day moving averages' 20-day average true range (ATR), after spending at least 80% of the previous two weeks and 80% of the prior 42 trading sessions above that trendline. This setup has appeared six other times over the last decade, after which the stock was higher one month later 100% of the time, averaging an 8.1% gain.
An unwinding of pessimism amongst options traders could provide tailwinds as well. At the International Securities Exchange (ISE), Cboe Options Exchange (CBOE), and NASDAQ OMX PHLX (PHLX), Carrier Global stock's 10-day put/call volume ratio of 1.18 sits higher than 85% of readings from the past year.
#global
According to Schaeffer's Senior Quantitative **** yst Rocky White, CARR is trading within 0.75 times the 200-day moving averages' 20-day average true range (ATR), after spending at least 80% of the previous two weeks and 80% of the prior 42 trading sessions above that trendline. This setup has appeared six other times over the last decade, after which the stock was higher one month later 100% of the time, averaging an 8.1% gain.
An unwinding of pessimism amongst options traders could provide tailwinds as well. At the International Securities Exchange (ISE), Cboe Options Exchange (CBOE), and NASDAQ OMX PHLX (PHLX), Carrier Global stock's 10-day put/call volume ratio of 1.18 sits higher than 85% of readings from the past year.
#global
1 month ago
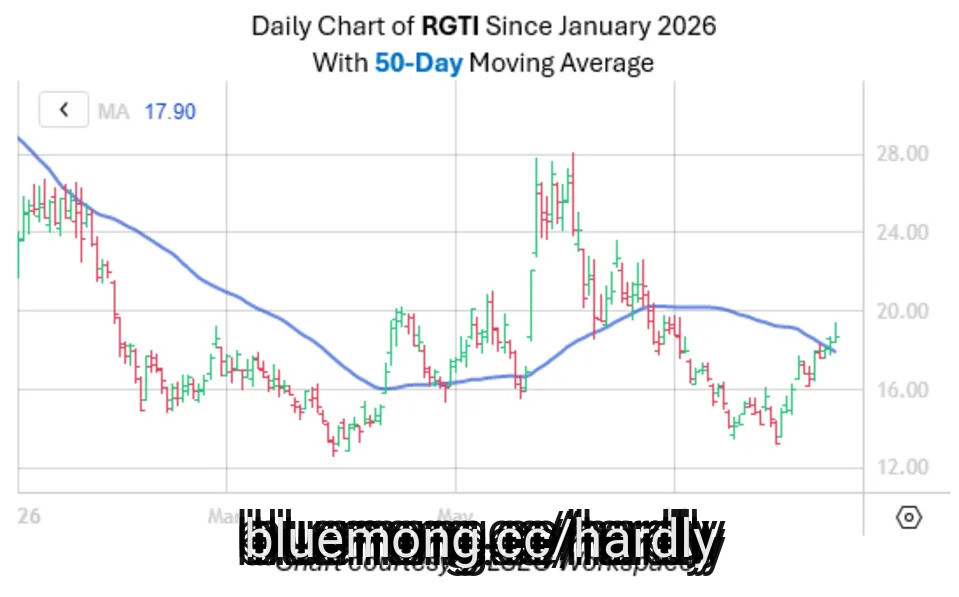
Rigetti Computing Inc (NASDAQ:RGTI) stock is clearing a trendline with historically bullish implications. The trendline in question is the stock's 50-day moving average. Per Schaeffer's Senior Quantitative ***** yst Rocky White, this "crossover" event happened nine other times in the last 10 years, after which the equity was higher 56% of the time, averaging a 19.19% gain.
The shares are pacing for their third straight daily win, continuing uphill and away from late-July lows. Plus, the 19.3% of Rigetti's available float sold short leaves plenty of room for short covering should the stock's momentum continue.
Rigetti sports a 50-day call/put volume ratio of 4.09 on the International Securities Exchange (ISE), Chicago Board Options Exchange (CBOE), and NASDAQ OMX PHLX (PHLX). This ratio stands higher than 98% of all other readings from the past year, hinting at strong bullish sentiment from long-term traders.
Options are incredibly affordable, per RGTI's Schaeffer's Volatility Index (SVI) of 82%, which stands higher than just 2% of all other readings from the past year, implying that near-term option traders are pricing in relatively low volatility expectations.
#higher #options #bullish
The shares are pacing for their third straight daily win, continuing uphill and away from late-July lows. Plus, the 19.3% of Rigetti's available float sold short leaves plenty of room for short covering should the stock's momentum continue.
Rigetti sports a 50-day call/put volume ratio of 4.09 on the International Securities Exchange (ISE), Chicago Board Options Exchange (CBOE), and NASDAQ OMX PHLX (PHLX). This ratio stands higher than 98% of all other readings from the past year, hinting at strong bullish sentiment from long-term traders.
Options are incredibly affordable, per RGTI's Schaeffer's Volatility Index (SVI) of 82%, which stands higher than just 2% of all other readings from the past year, implying that near-term option traders are pricing in relatively low volatility expectations.
#higher #options #bullish
1 month ago
E-commerce platform Wayfair Inc (NYSE:W) enjoyed a massive 30% post-earnings bull gap last week. The stock has managed to hold on to most of those gains, with support emerging at the $104 level, and an unwinding of pessimism amongst options traders could help push it even higher.
W sports a 50-day put/call volume ratio of 1.71 at the International Securities Exchange (ISE), Cboe Options Exchange (CBOE), and NASDAQ OMX PHLX (PHLX) that stands higher than 99% of readings from the past year.
There have been three instances in the last three years that the equity's 50-day buy-to-open put/call ratio crossed over 1.0 and moved into the 90th percentile. Per Schaeffer's Senior Quantitative ****** yst Rocky White, Wayfair was higher one month later 100% of the time after these signals with an average 11.1% return. From its current perch, this would put the stock back near $587.
Plus, short interest represents 14.2% of the stock's available float. It would take shorts nearly four days to cover their bets, at W's average pace of trading.
#exchange
W sports a 50-day put/call volume ratio of 1.71 at the International Securities Exchange (ISE), Cboe Options Exchange (CBOE), and NASDAQ OMX PHLX (PHLX) that stands higher than 99% of readings from the past year.
There have been three instances in the last three years that the equity's 50-day buy-to-open put/call ratio crossed over 1.0 and moved into the 90th percentile. Per Schaeffer's Senior Quantitative ****** yst Rocky White, Wayfair was higher one month later 100% of the time after these signals with an average 11.1% return. From its current perch, this would put the stock back near $587.
Plus, short interest represents 14.2% of the stock's available float. It would take shorts nearly four days to cover their bets, at W's average pace of trading.
#exchange

2 months ago
During the lightning round on the August 5 episode of CNBC's Mad Money, host Jim Cramer responded to a caller asking about CME Group Inc. (NASDAQ:CME). He commented:
CME Group is very good. I've got to tell you, I like Cboe, too. I've always liked the companies that are involved with trading because they have monopolies or at least duopolies.
Cramer's endorsement highlights the core economic moat that protects exchange operators like CME Group Inc. (NASDAQ:CME). As the world's largest financial derivatives exchange, the company controls major market infrastructure across interest rates, equity indices, energy, agricultural commodities, and foreign exchange.
When evaluating CME Group Inc. (NASDAQ:CME) on August 5, Cramer explicitly brought up Cboe Global Markets Inc. (NASDAQ:CBOE), grouping the two together as prime examples of exchange operators with pricing power. His mention builds directly on commentary from the August 3 episode of Mad Money, where Cramer highlighted Cboe as one of July's standout performers after gaining 27.8%. He remarked:
Now, in sixth place, there's… Cboe Global Markets… big options marketplace, is up 27.8%. And that's all about the volatility that gradually built throughout the month. Cboe also reported a solid quarter last Friday, giving its stock one more leg higher. I don't think it's expensive.
#cboe #august #i 've
CME Group is very good. I've got to tell you, I like Cboe, too. I've always liked the companies that are involved with trading because they have monopolies or at least duopolies.
Cramer's endorsement highlights the core economic moat that protects exchange operators like CME Group Inc. (NASDAQ:CME). As the world's largest financial derivatives exchange, the company controls major market infrastructure across interest rates, equity indices, energy, agricultural commodities, and foreign exchange.
When evaluating CME Group Inc. (NASDAQ:CME) on August 5, Cramer explicitly brought up Cboe Global Markets Inc. (NASDAQ:CBOE), grouping the two together as prime examples of exchange operators with pricing power. His mention builds directly on commentary from the August 3 episode of Mad Money, where Cramer highlighted Cboe as one of July's standout performers after gaining 27.8%. He remarked:
Now, in sixth place, there's… Cboe Global Markets… big options marketplace, is up 27.8%. And that's all about the volatility that gradually built throughout the month. Cboe also reported a solid quarter last Friday, giving its stock one more leg higher. I don't think it's expensive.
#cboe #august #i 've


2 months ago
Greenskeeper ****** et Management, an independent firm that specializes in disciplined value investing, recently released its Q2 2026 scorecard. A copy is available to download here. After a slow start to the year, the Fund gained 10.9% in the quarter, lifting its year-to-date return to 1.9%. The rebound came as markets showed signs of rotating away from momentum stocks and toward companies supported by reasonable valuations. Please review the Fund's top five holdings to gain insights into their key selections for 2026.
According to Greenskeeper ****** et Management's Q2 2026 investor letter, Intercontinental Exchange, Inc. (NYSE:ICE), a US-based financial services company that provides technology, data, and market infrastructure to financial institutions, corporations, and government entities, detracted from the performance. On August 03, 2026, Intercontinental Exchange, Inc. (NYSE:ICE) closed at $151.80 per share, reflecting a market capitalization of $85.22 billion. Intercontinental Exchange, Inc. (NYSE:ICE) posted a one-month return of 11.25%, and its shares lost 19.00% over the past 52 weeks.
Greenskeeper ****** et Management stated the following regarding Intercontinental Exchange, Inc. (NYSE:ICE) in its Q2 2026 investor letter:
"Our largest detractor during the quarter was Intercontinental Exchange, Inc. (NYSE:ICE), which declined 21.7%. The company's underlying performance remains strong, with revenue and earnings increasing 20% and 34%, respectively, to start the year. Nevertheless, ICE's shares declined alongside peers including Cboe Global Markets (CBOE) and CME Group (CME), amid concerns of a cyclical peak in earnings.
Investors are also concerned that a relatively new product known as "perpetual futures" could pose a competitive threat to incumbent derivatives exchanges. Trading activity is currently concentrated in cryptocurrency markets, but several recent product announcements have raised concerns that perpetual futures could expand into more traditional ****** et classes..." (Click here to read the full text)
#intercontinental #asset #greenskeeper #cboe
According to Greenskeeper ****** et Management's Q2 2026 investor letter, Intercontinental Exchange, Inc. (NYSE:ICE), a US-based financial services company that provides technology, data, and market infrastructure to financial institutions, corporations, and government entities, detracted from the performance. On August 03, 2026, Intercontinental Exchange, Inc. (NYSE:ICE) closed at $151.80 per share, reflecting a market capitalization of $85.22 billion. Intercontinental Exchange, Inc. (NYSE:ICE) posted a one-month return of 11.25%, and its shares lost 19.00% over the past 52 weeks.
Greenskeeper ****** et Management stated the following regarding Intercontinental Exchange, Inc. (NYSE:ICE) in its Q2 2026 investor letter:
"Our largest detractor during the quarter was Intercontinental Exchange, Inc. (NYSE:ICE), which declined 21.7%. The company's underlying performance remains strong, with revenue and earnings increasing 20% and 34%, respectively, to start the year. Nevertheless, ICE's shares declined alongside peers including Cboe Global Markets (CBOE) and CME Group (CME), amid concerns of a cyclical peak in earnings.
Investors are also concerned that a relatively new product known as "perpetual futures" could pose a competitive threat to incumbent derivatives exchanges. Trading activity is currently concentrated in cryptocurrency markets, but several recent product announcements have raised concerns that perpetual futures could expand into more traditional ****** et classes..." (Click here to read the full text)
#intercontinental #asset #greenskeeper #cboe


2 months ago
Greenskeeper **** et Management, an independent firm that specializes in disciplined value investing, recently released its Q2 2026 scorecard. A copy is available to download here. After a slow start to the year, the Fund gained 10.9% in the quarter, lifting its year-to-date return to 1.9%. The rebound came as markets showed signs of rotating away from momentum stocks and toward companies supported by reasonable valuations. Please review the Fund's top five holdings to gain insights into their key selections for 2026.
According to Greenskeeper **** et Management's Q2 2026 investor letter, Intercontinental Exchange, Inc. (NYSE:ICE), a US-based financial services company that provides technology, data, and market infrastructure to financial institutions, corporations, and government entities, detracted from the performance. On August 03, 2026, Intercontinental Exchange, Inc. (NYSE:ICE) closed at $151.80 per share, reflecting a market capitalization of $85.22 billion. Intercontinental Exchange, Inc. (NYSE:ICE) posted a one-month return of 11.25%, and its shares lost 19.00% over the past 52 weeks.
Greenskeeper **** et Management stated the following regarding Intercontinental Exchange, Inc. (NYSE:ICE) in its Q2 2026 investor letter:
"Our largest detractor during the quarter was Intercontinental Exchange, Inc. (NYSE:ICE), which declined 21.7%. The company's underlying performance remains strong, with revenue and earnings increasing 20% and 34%, respectively, to start the year. Nevertheless, ICE's shares declined alongside peers including Cboe Global Markets (CBOE) and CME Group (CME), amid concerns of a cyclical peak in earnings.
Investors are also concerned that a relatively new product known as "perpetual futures" could pose a competitive threat to incumbent derivatives exchanges. Trading activity is currently concentrated in cryptocurrency markets, but several recent product announcements have raised concerns that perpetual futures could expand into more traditional **** et classes..." (Click here to read the full text)
#NYSE #management #here
According to Greenskeeper **** et Management's Q2 2026 investor letter, Intercontinental Exchange, Inc. (NYSE:ICE), a US-based financial services company that provides technology, data, and market infrastructure to financial institutions, corporations, and government entities, detracted from the performance. On August 03, 2026, Intercontinental Exchange, Inc. (NYSE:ICE) closed at $151.80 per share, reflecting a market capitalization of $85.22 billion. Intercontinental Exchange, Inc. (NYSE:ICE) posted a one-month return of 11.25%, and its shares lost 19.00% over the past 52 weeks.
Greenskeeper **** et Management stated the following regarding Intercontinental Exchange, Inc. (NYSE:ICE) in its Q2 2026 investor letter:
"Our largest detractor during the quarter was Intercontinental Exchange, Inc. (NYSE:ICE), which declined 21.7%. The company's underlying performance remains strong, with revenue and earnings increasing 20% and 34%, respectively, to start the year. Nevertheless, ICE's shares declined alongside peers including Cboe Global Markets (CBOE) and CME Group (CME), amid concerns of a cyclical peak in earnings.
Investors are also concerned that a relatively new product known as "perpetual futures" could pose a competitive threat to incumbent derivatives exchanges. Trading activity is currently concentrated in cryptocurrency markets, but several recent product announcements have raised concerns that perpetual futures could expand into more traditional **** et classes..." (Click here to read the full text)
#NYSE #management #here


2 months ago
BTCI's monthly payouts dropped from $1.04 to $0.65 in 2026, shrinking the forward yield to 8% versus a misleading 40% trailing headline.
Down 23% year to date with a -2% average annual return since inception, BTCI cushions Bitcoin losses but cannot prevent negative total returns.
Don't wait: the **** yst who called NVIDIA in 2010 just revealed his top 10 AI stocks. See the full list FREE now.
The NEOS Bitcoin High Income ETF (CBOE:BTCI) markets itself as a way to earn equity-like income from Bitcoin's volatility. BTCI pays monthly, uses a synthetic covered call overlay on Bitcoin exposure, and has distributed at rates translating into a headline yield well above 15%. This piece examines how BTCI generates that cash flow, whether the current distribution level is durable, and what trailing price action reveals about total returns.
This Bitcoin-oriented vehicle holds BTC exposure indirectly rather than through spot coins. According to the fund's holdings snapshot, roughly 56% of **** ets sit in U.S. Treasury bills, with Bitcoin exposure coming through positions in iShares Bitcoin Trust (roughly 13%) and VanEck's HODL (roughly 7%). The manager writes call options on Bitcoin ETFs and may layer in bear call spreads, a structure described in fund coverage as a synthetic covered call approach. BTCI's design aims to generate income while maintaining indirect exposure to Bitcoin price movements.
#btci
Down 23% year to date with a -2% average annual return since inception, BTCI cushions Bitcoin losses but cannot prevent negative total returns.
Don't wait: the **** yst who called NVIDIA in 2010 just revealed his top 10 AI stocks. See the full list FREE now.
The NEOS Bitcoin High Income ETF (CBOE:BTCI) markets itself as a way to earn equity-like income from Bitcoin's volatility. BTCI pays monthly, uses a synthetic covered call overlay on Bitcoin exposure, and has distributed at rates translating into a headline yield well above 15%. This piece examines how BTCI generates that cash flow, whether the current distribution level is durable, and what trailing price action reveals about total returns.
This Bitcoin-oriented vehicle holds BTC exposure indirectly rather than through spot coins. According to the fund's holdings snapshot, roughly 56% of **** ets sit in U.S. Treasury bills, with Bitcoin exposure coming through positions in iShares Bitcoin Trust (roughly 13%) and VanEck's HODL (roughly 7%). The manager writes call options on Bitcoin ETFs and may layer in bear call spreads, a structure described in fund coverage as a synthetic covered call approach. BTCI's design aims to generate income while maintaining indirect exposure to Bitcoin price movements.
#btci


2 months ago
DGJL uses SPY options to deliver a fixed 9.37% digital return as long as SPY doesn't fall more than 10% over its one-year period.
The digital structure caps gains at 9.37% even if SPY surges 30%, making DGJL most advantageous in flat or mildly declining markets.
Losses beyond the 10% buffer fall entirely on shareholders, and defined outcomes only hold for investors who buy on day one and hold through July 2027.
Act now: the ***** yst who called NVIDIA in 2010 just named his top 10 AI stocks — and DGJL didn't make the cut. Grab the names FREE today.
First Trust has rolled out another entry in its lineup of defined-outcome funds, and this one carries an unusual twist. The FT Vest U.S. Equity Buffer & Digital Return ETF – July (NYSEARCA:DGJL) began its first outcome period on July 20, 2026 and lists on the Cboe BZX Exchange. It is an actively managed fund, meaning a team picks the holdings rather than tracking an index, and it is sub-advised by Vest Financial LLC, the firm behind most of First Trust's buffer product family.
#first #digital #vest
The digital structure caps gains at 9.37% even if SPY surges 30%, making DGJL most advantageous in flat or mildly declining markets.
Losses beyond the 10% buffer fall entirely on shareholders, and defined outcomes only hold for investors who buy on day one and hold through July 2027.
Act now: the ***** yst who called NVIDIA in 2010 just named his top 10 AI stocks — and DGJL didn't make the cut. Grab the names FREE today.
First Trust has rolled out another entry in its lineup of defined-outcome funds, and this one carries an unusual twist. The FT Vest U.S. Equity Buffer & Digital Return ETF – July (NYSEARCA:DGJL) began its first outcome period on July 20, 2026 and lists on the Cboe BZX Exchange. It is an actively managed fund, meaning a team picks the holdings rather than tracking an index, and it is sub-advised by Vest Financial LLC, the firm behind most of First Trust's buffer product family.
#first #digital #vest


2 months ago
Cboe Global Markets, Inc. (CBOE) is a leading global exchange operator and financial markets infrastructure company valued at a market cap of $29.5 billion. Headquartered in Chicago, Illinois, it operates exchanges for options, equities, futures, foreign exchange (FX), and digital ******* ets, serving institutional and retail investors worldwide.
The world's leading derivatives and securities exchange network is expected to announce its fiscal second-quarter earnings for 2026 before the market opens on Friday, Jul. 31. Ahead of the event, ******* ysts expect CBOE to report a profit of $3.41 per share on a diluted basis, up 38.6% from $2.46 per share in the year-ago quarter. The company beat the consensus estimates in each of the last four quarters.
Dear ******* eX Stock Fans, Mark Your Calendars for July 23
Walmart Stock's Extended Downturn Could Trigger a Possible Comeback
The Biggest Risk to ******* eX Stock Comes After Earnings. Here Are The Numbers You Should Keep An Eye On.
#earnings #market
The world's leading derivatives and securities exchange network is expected to announce its fiscal second-quarter earnings for 2026 before the market opens on Friday, Jul. 31. Ahead of the event, ******* ysts expect CBOE to report a profit of $3.41 per share on a diluted basis, up 38.6% from $2.46 per share in the year-ago quarter. The company beat the consensus estimates in each of the last four quarters.
Dear ******* eX Stock Fans, Mark Your Calendars for July 23
Walmart Stock's Extended Downturn Could Trigger a Possible Comeback
The Biggest Risk to ******* eX Stock Comes After Earnings. Here Are The Numbers You Should Keep An Eye On.
#earnings #market


2 months ago
Nvidia (NVDA) CEO Jensen Huang's signed leather jacket sold for $960,000 Friday, the same day semiconductor stocks fell into a bear market. The contrast captures an AI boom with a cultural appeal that remains intact even as traders brace for much larger swings in its most important stocks.
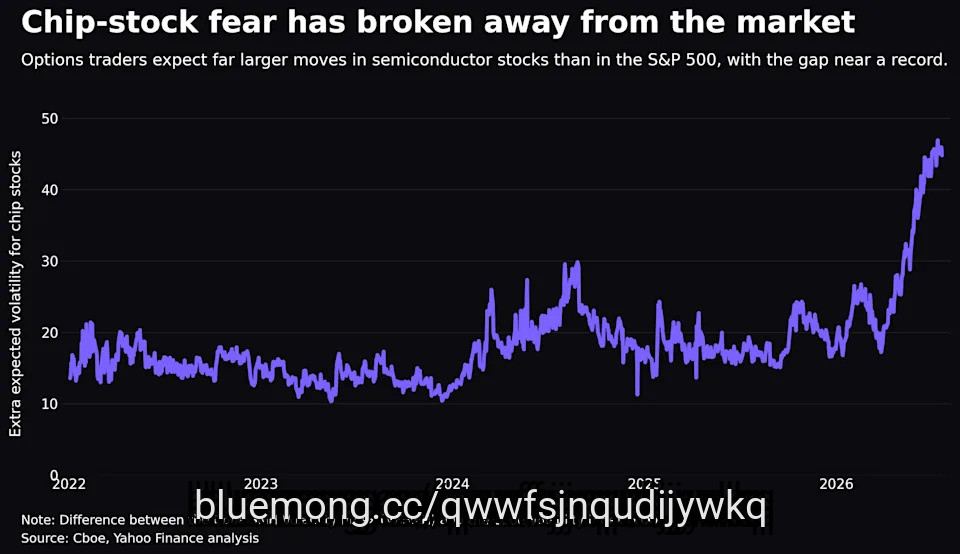
Fear has surged in chip stocks while remaining remarkably contained across the broader market. The Cboe SMH Volatility Index uses options prices to estimate expected movement over the next 30 days in the VanEck Semiconductor ETF (SMH). The Cboe Volatility Index (^VIX) measures the same basic thing for the S&P 500.
Subtracting one from the other shows how much extra turbulence traders expect from chip stocks. That gap recently reached nearly 47 volatility points and remains close to 45.
That is a striking departure from the broad market panic after the "Liberation Day" tariffs were announced in April 2025. When the VIX surged over 50, the chip volatility premium was less than half its current size.
Back then, fear was everywhere. Today, it is concentrated in chips.
#stocks #semiconductor #same
Fear has surged in chip stocks while remaining remarkably contained across the broader market. The Cboe SMH Volatility Index uses options prices to estimate expected movement over the next 30 days in the VanEck Semiconductor ETF (SMH). The Cboe Volatility Index (^VIX) measures the same basic thing for the S&P 500.
Subtracting one from the other shows how much extra turbulence traders expect from chip stocks. That gap recently reached nearly 47 volatility points and remains close to 45.
That is a striking departure from the broad market panic after the "Liberation Day" tariffs were announced in April 2025. When the VIX surged over 50, the chip volatility premium was less than half its current size.
Back then, fear was everywhere. Today, it is concentrated in chips.
#stocks #semiconductor #same
2 months ago
NOBL's equal weighting across 70 holdings and a 44% fund-level payout ratio give its 2% yield a durable, compounding foundation.
CVX posted negative Q1 free cash flow and a 37% net income drop, but its 1.4% weight limits damage to ***** L's income stream.
JNJ and KO anchor the income story with 64 and 60-plus consecutive dividend raises and payout ratios comfortably below 65%.
Act now: the ***** yst who called NVIDIA in 2010 just named his top 10 AI stocks — and Johnson & Johnson didn't make the cut. Grab the names FREE today.
The ProShares S&P 500 Dividend Aristocrats ETF (CBOE:NOBL) pays a roughly 2% dividend yield built on a portfolio of 70 holdings, each of which has raised its dividend for at least 25 consecutive years. Income investors buy ***** L for a specific promise: that the underlying companies are so entrenched in their markets that quarterly dividend growth continues through recessions, inflation shocks, and rate cycles. That promise faces a test in mid-2026, especially across the five holdings most investors watch as bellwethers for the group.
#Dividend #income #across #consecutive
CVX posted negative Q1 free cash flow and a 37% net income drop, but its 1.4% weight limits damage to ***** L's income stream.
JNJ and KO anchor the income story with 64 and 60-plus consecutive dividend raises and payout ratios comfortably below 65%.
Act now: the ***** yst who called NVIDIA in 2010 just named his top 10 AI stocks — and Johnson & Johnson didn't make the cut. Grab the names FREE today.
The ProShares S&P 500 Dividend Aristocrats ETF (CBOE:NOBL) pays a roughly 2% dividend yield built on a portfolio of 70 holdings, each of which has raised its dividend for at least 25 consecutive years. Income investors buy ***** L for a specific promise: that the underlying companies are so entrenched in their markets that quarterly dividend growth continues through recessions, inflation shocks, and rate cycles. That promise faces a test in mid-2026, especially across the five holdings most investors watch as bellwethers for the group.
#Dividend #income #across #consecutive
3 months ago
QDTE's weekly distributions have dropped from a $0.35 per-share average in 2024 to $0.19 in 2026 as VIX compression steadily shrinks option premiums.
QDTE's trailing 48% yield is misleading, given that QQQ already outpaces it year-to-date at 16% vs 12%, while sister fund XDTE offers a lower-decay alternative.
It sounds nuts, but SoFi is giving new active invest users up to $1,000 in stock for a limited time, and all it takes is a $50 deposit to get started. See for yourself (Sponsor)
The Roundhill Innovation-100 0DTE Covered Call Strategy ETF (CBOE:QDTE) pays income every single week, and that cadence is the entire reason people own it. QDTE sells zero-days-to-expiration call options against synthetic NASDAQ-100 exposure, then routes the collected premiums back to shareholders as distributions that most recently ran $0.24 per share on July 1, 2026. With a trailing 12-month yield near 48%, the question every QDTE holder needs answered is not whether the checks will keep arriving, but whether they will keep arriving at anything close to today's size.
QDTE does not own the NASDAQ-100 outright. Its March 2026 NPORT filing shows roughly 90% of the fund's $798.9 million in net ****** ets tied up in four derivative positions that synthetically replicate the index, while the remaining collateral sits in the First American Government Obligations fund and the Roundhill Weekly T-Bill ETF (WEEK). Each morning, the manager writes 0DTE calls near the money on that synthetic exposure. Buyers pay premium for a one-day lottery ticket. If the index closes below strike, QDTE keeps the premium. If it blows through the strike, the position caps out and the fund gives up the rally.
QDTE's trailing 48% yield is misleading, given that QQQ already outpaces it year-to-date at 16% vs 12%, while sister fund XDTE offers a lower-decay alternative.
It sounds nuts, but SoFi is giving new active invest users up to $1,000 in stock for a limited time, and all it takes is a $50 deposit to get started. See for yourself (Sponsor)
The Roundhill Innovation-100 0DTE Covered Call Strategy ETF (CBOE:QDTE) pays income every single week, and that cadence is the entire reason people own it. QDTE sells zero-days-to-expiration call options against synthetic NASDAQ-100 exposure, then routes the collected premiums back to shareholders as distributions that most recently ran $0.24 per share on July 1, 2026. With a trailing 12-month yield near 48%, the question every QDTE holder needs answered is not whether the checks will keep arriving, but whether they will keep arriving at anything close to today's size.
QDTE does not own the NASDAQ-100 outright. Its March 2026 NPORT filing shows roughly 90% of the fund's $798.9 million in net ****** ets tied up in four derivative positions that synthetically replicate the index, while the remaining collateral sits in the First American Government Obligations fund and the Roundhill Weekly T-Bill ETF (WEEK). Each morning, the manager writes 0DTE calls near the money on that synthetic exposure. Buyers pay premium for a one-day lottery ticket. If the index closes below strike, QDTE keeps the premium. If it blows through the strike, the position caps out and the fund gives up the rally.


3 months ago
I frequently ******* yze ETFs whose returns are tied to the movement of volatility, specifically to the Cboe Volatility Index ($VIX). I have tracked and have owned several of them over the years.
To me, being "long" volatility is the key feature of these ETFs. It allows me an alternative to S&P 500 Index ($SPX) put options.
Broadcom's Largest AI Customer Is Fleeing to MediaTek. AVGO Stock Is Still a Buy.
Nasdaq Futures Plunge as Samsung Sparks Chip Selloff
Mark Cuban Asks What If You Didn't Need Health Insurance — And Hospitals Just Treated You, Then Took 10% of Your Pay?
To me, being "long" volatility is the key feature of these ETFs. It allows me an alternative to S&P 500 Index ($SPX) put options.
Broadcom's Largest AI Customer Is Fleeing to MediaTek. AVGO Stock Is Still a Buy.
Nasdaq Futures Plunge as Samsung Sparks Chip Selloff
Mark Cuban Asks What If You Didn't Need Health Insurance — And Hospitals Just Treated You, Then Took 10% of Your Pay?



3 months ago
SPYI beat JEPI by returning roughly 19% versus 8% over the past year, but JEPI's defensive low-volatility structure better cushions market drawdowns.
SPYI's SPX index options unlock Section 1256 tax treatment, deferring taxes through return-of-capital distributions and making it the stronger pick for taxable accounts.
Many financial professionals are salespeople paid on what they push, not whether you end up wealthier. A fiduciary is the opposite. The SEC legally requires them to put your interests first. Advisor.com's free matching tool pairs you with vetted fiduciaries from major national firms, all in under three minutes. See who you match with today.
Income investors chasing monthly checks from S&P 500 covered-call ETFs keep landing on the same two tickers: Neos S&P 500 High Income ETF (CBOE:SPYI) and JPMorgan Equity Premium Income ETF (NYSEARCA:JEPI). Both promise high, steady payouts by selling options on large-cap U.S. equities. They look interchangeable on a screener, yet their construction diverges sharply. One is engineered around tax efficiency and full index exposure. The other is built to smooth volatility, and it accepts lower upside as the cost of that smoothing. The choice comes down to which trade-off you actually want.
JEPI holds an actively selected, low-volatility subset of the S&P 500 and layers equity-linked notes (ELNs) on top to generate premium income. The stock sleeve is deliberately defensive: top holdings include Broadcom at 1.8%, Ross Stores at 1.7%, and Apple at 1.7%, with the top 10 representing just 16.4% of the portfolio. The implicit bet is that a lower-beta equity book plus ELN income will beat the S&P on a risk-adjusted basis when markets chop or fall.
SPYI's SPX index options unlock Section 1256 tax treatment, deferring taxes through return-of-capital distributions and making it the stronger pick for taxable accounts.
Many financial professionals are salespeople paid on what they push, not whether you end up wealthier. A fiduciary is the opposite. The SEC legally requires them to put your interests first. Advisor.com's free matching tool pairs you with vetted fiduciaries from major national firms, all in under three minutes. See who you match with today.
Income investors chasing monthly checks from S&P 500 covered-call ETFs keep landing on the same two tickers: Neos S&P 500 High Income ETF (CBOE:SPYI) and JPMorgan Equity Premium Income ETF (NYSEARCA:JEPI). Both promise high, steady payouts by selling options on large-cap U.S. equities. They look interchangeable on a screener, yet their construction diverges sharply. One is engineered around tax efficiency and full index exposure. The other is built to smooth volatility, and it accepts lower upside as the cost of that smoothing. The choice comes down to which trade-off you actually want.
JEPI holds an actively selected, low-volatility subset of the S&P 500 and layers equity-linked notes (ELNs) on top to generate premium income. The stock sleeve is deliberately defensive: top holdings include Broadcom at 1.8%, Ross Stores at 1.7%, and Apple at 1.7%, with the top 10 representing just 16.4% of the portfolio. The implicit bet is that a lower-beta equity book plus ELN income will beat the S&P on a risk-adjusted basis when markets chop or fall.