

27 days ago
Rising interest rates have the US on a collision course with the need to finally deal with its bloated debt pile, Goldman Sachs warns.
"Persistently higher rates would boost interest expense as a share of GDP — a key gauge of the cash outflows needed to service the debt — and push the debt-to-GDP ratio up to 132% by 2035, 10 percentage points above our baseline, raising the odds that deficit reduction becomes necessary sooner to stabilize the debt," Goldman Sachs strategist Pierfrancesco Mei wrote in a new note on Tuesday.
US Treasury yields have climbed aggressively this year, effectively pushing up the country's debt servicing costs. The benchmark 10-year Treasury yield (^TNX) has surged more than 115 basis points, from around 4.10% late last year to a 24-year high of around 5.28% at present.
Read more: How soaring Treasury yields could hit your finances
This sustained sell-off across the bond market has been fueled by inflation brought on by the US war on Iran, which prompted the Federal Reserve to hike interest rates last month. The economy's resilience in the face of pricing pressures has also contributed to the sell-off.
#points #yields
"Persistently higher rates would boost interest expense as a share of GDP — a key gauge of the cash outflows needed to service the debt — and push the debt-to-GDP ratio up to 132% by 2035, 10 percentage points above our baseline, raising the odds that deficit reduction becomes necessary sooner to stabilize the debt," Goldman Sachs strategist Pierfrancesco Mei wrote in a new note on Tuesday.
US Treasury yields have climbed aggressively this year, effectively pushing up the country's debt servicing costs. The benchmark 10-year Treasury yield (^TNX) has surged more than 115 basis points, from around 4.10% late last year to a 24-year high of around 5.28% at present.
Read more: How soaring Treasury yields could hit your finances
This sustained sell-off across the bond market has been fueled by inflation brought on by the US war on Iran, which prompted the Federal Reserve to hike interest rates last month. The economy's resilience in the face of pricing pressures has also contributed to the sell-off.
#points #yields



27 days ago
Rising interest rates have the US on a collision course with finally having to deal with its bloated debt pile, warns Goldman Sachs.
"Persistently higher rates would boost interest expense as a share of GDP—a key gauge of the cash outflows needed to service the debt—and push the debt-to-GDP ratio up to 132% by 2035, 10 percentage points above our baseline, raising the odds that deficit reduction becomes necessary sooner to stabilize the debt," said Goldman Sachs strategist Pierfrancesco Mei in a new note on Tuesday.
US Treasury yields have climbed aggressively this year, effectively pushing up the country's debt servicing costs. The benchmark 10-year Treasury yield has surged more than 115 basis points, from around 4.10% late last year to a 24-year high of around 5.28% at present.
This sustained sell-off across the bond market has been fueled by inflation brought on by the US war on Iran, which prompted the Federal Reserve to hike interest rates last month. The economy's resilience in the face of pricing pressures has also contributed to the sell-off.
What's happening in the bond market couldn't come at a worse time for US debt watchers.
#interest
"Persistently higher rates would boost interest expense as a share of GDP—a key gauge of the cash outflows needed to service the debt—and push the debt-to-GDP ratio up to 132% by 2035, 10 percentage points above our baseline, raising the odds that deficit reduction becomes necessary sooner to stabilize the debt," said Goldman Sachs strategist Pierfrancesco Mei in a new note on Tuesday.
US Treasury yields have climbed aggressively this year, effectively pushing up the country's debt servicing costs. The benchmark 10-year Treasury yield has surged more than 115 basis points, from around 4.10% late last year to a 24-year high of around 5.28% at present.
This sustained sell-off across the bond market has been fueled by inflation brought on by the US war on Iran, which prompted the Federal Reserve to hike interest rates last month. The economy's resilience in the face of pricing pressures has also contributed to the sell-off.
What's happening in the bond market couldn't come at a worse time for US debt watchers.
#interest




1 month ago
Sept 18 (Reuters) - US equity funds recorded outflows for a fourth consecutive week in the week to September 18, as rising crude oil prices heightened inflation concerns and expectations of a Federal Reserve rate hike added to investor caution ahead of its policy decision.
US equity funds recorded net redemptions of $31.44 billion during the week, largely matching the $32 billion withdrawn a week earlier, LSEG Lipper data showed.
Crude oil prices rose to four-month highs during the week, fueling inflation concerns and lifting Treasury yields, which weighed on growth-oriented funds.
The Fed raised interest rates by 25 basis points on Wednesday and signaled that further tightening may be needed to curb inflation fueled by higher energy costs linked to the war in Iran.
Investors withdrew $28.71 billion, $1.73 billion and $3.16 billion from US large-cap, mid-cap and multi-cap funds, respectively. In contrast, small-cap funds attracted $568 million in weekly inflows.
#funds #recorded #concerns
US equity funds recorded net redemptions of $31.44 billion during the week, largely matching the $32 billion withdrawn a week earlier, LSEG Lipper data showed.
Crude oil prices rose to four-month highs during the week, fueling inflation concerns and lifting Treasury yields, which weighed on growth-oriented funds.
The Fed raised interest rates by 25 basis points on Wednesday and signaled that further tightening may be needed to curb inflation fueled by higher energy costs linked to the war in Iran.
Investors withdrew $28.71 billion, $1.73 billion and $3.16 billion from US large-cap, mid-cap and multi-cap funds, respectively. In contrast, small-cap funds attracted $568 million in weekly inflows.
#funds #recorded #concerns


1 month ago
Virtus Investment Partners, Inc. (NYSE:VRTS) reported on September 11 that preliminary ****** ets under management, or AUM, totaled $147.501 billion at August-end, compared with $148.874 billion at July-end. That represents a $1.373 billion decline, or approximately 0.9%.
Management identified net outflows in institutional accounts, retail separate accounts, U.S. retail funds and global funds, partly offset by positive flows into exchange-traded funds, or ETFs, and tender-offer funds.
Positive market performance partly offset net outflows. The $1.373 billion AUM decline therefore differs from net client withdrawals, which the announcement did not quantify. The underlying business question is whether products attracting new money can become large enough to stabilize the revenue base.
Virtus Investment Partners, Inc. (NYSE:VRTS) has identifiable sources of customer demand. Positive net flows into ETFs and tender-offer funds provide a route toward a more balanced product mix.
ETF demand also appeared in the second quarter, when these products attracted $0.3 billion of net inflows. August's positive flows suggest the opportunity extends beyond a single reporting period.
#virtus #investment #partners
Management identified net outflows in institutional accounts, retail separate accounts, U.S. retail funds and global funds, partly offset by positive flows into exchange-traded funds, or ETFs, and tender-offer funds.
Positive market performance partly offset net outflows. The $1.373 billion AUM decline therefore differs from net client withdrawals, which the announcement did not quantify. The underlying business question is whether products attracting new money can become large enough to stabilize the revenue base.
Virtus Investment Partners, Inc. (NYSE:VRTS) has identifiable sources of customer demand. Positive net flows into ETFs and tender-offer funds provide a route toward a more balanced product mix.
ETF demand also appeared in the second quarter, when these products attracted $0.3 billion of net inflows. August's positive flows suggest the opportunity extends beyond a single reporting period.
#virtus #investment #partners


2 months ago
Investors were quick to pull money out of spot Bitcoin (CRYPTO: $BTC) exchange-traded funds (ETFs) after the Clarity Act failed to advance in the U.S. Senate.
Market data shows that a dozen Bitcoin ETFs in the U.S. saw outflows of $450 million U.S. on Sept. 15, the biggest one-day redemption since June 25th of this year.
The outflows came shortly after the U.S. Senate declined to advance the "Digital **** et Market Clarity Act" that would provide a regulatory framework for cryptocurrencies.
More From Cryptoprowl:
MEXC Launches Earn Plus With Limited-Time Event Offering Up to 800% APR Booster
#Crypto
Market data shows that a dozen Bitcoin ETFs in the U.S. saw outflows of $450 million U.S. on Sept. 15, the biggest one-day redemption since June 25th of this year.
The outflows came shortly after the U.S. Senate declined to advance the "Digital **** et Market Clarity Act" that would provide a regulatory framework for cryptocurrencies.
More From Cryptoprowl:
MEXC Launches Earn Plus With Limited-Time Event Offering Up to 800% APR Booster
#Crypto


2 months ago
The choice between established ****** ans and digital-first challengers defines many modern portfolios. In the financial realm, investors must decide if JPMorgan Chase (NYSE:JPM) or SoFi Technologies (NASDAQ:SOFI) is the better buy for long-term growth.
JPMorgan Chase operates as a global financial heavyweight, offering everything from wealth management to retail branches. Conversely, SoFi Technologies focuses on an integrated mobile app to help members borrow, save, and invest. While one relies on massive scale, the other bets on fintech innovation to capture a younger, tech-savvy demographic.
JPMorgan Chase functions as a cornerstone of the global economy, managing a vast array of services including ****** et management and investment banking. In its latest annual report, filed for 2025, the firm highlighted its reach through more than 5,000 branches across the 48 contiguous states. It serves a diverse client base ranging from individual consumers and small businesses to large corporations and governments. The firm provides a comprehensive range of financial services, including transaction processing and commercial banking on a global scale.
Financial performance remained robust in FY 2025, with revenue reaching nearly $182.4 billion. This represented a growth rate of approximately 3.3% compared to the previous year, contributing to a net income of close to $57.0 billion. The net margin, which measures the percentage of revenue kept as profit after all expenses, sat at roughly 20.4% for the period. This consistent profitability underscores the scale of its operations across diverse global markets.
As of its December 2025 balance sheet, the firm reported a debt-to-equity ratio of nearly 2.6x. This ratio measures total debt against shareholder equity, with a higher number indicating more reliance on borrowed funds to finance growth. The current ratio, which compares short-term ****** ets to short-term liabilities, was approximately 0.5x, while free cash flow reached a negative $147.8 billion. Free cash flow is the cash a company generates after accounting for cash outflows to support operations and maintain its capital ****** ets.
#sofi #global #term
JPMorgan Chase operates as a global financial heavyweight, offering everything from wealth management to retail branches. Conversely, SoFi Technologies focuses on an integrated mobile app to help members borrow, save, and invest. While one relies on massive scale, the other bets on fintech innovation to capture a younger, tech-savvy demographic.
JPMorgan Chase functions as a cornerstone of the global economy, managing a vast array of services including ****** et management and investment banking. In its latest annual report, filed for 2025, the firm highlighted its reach through more than 5,000 branches across the 48 contiguous states. It serves a diverse client base ranging from individual consumers and small businesses to large corporations and governments. The firm provides a comprehensive range of financial services, including transaction processing and commercial banking on a global scale.
Financial performance remained robust in FY 2025, with revenue reaching nearly $182.4 billion. This represented a growth rate of approximately 3.3% compared to the previous year, contributing to a net income of close to $57.0 billion. The net margin, which measures the percentage of revenue kept as profit after all expenses, sat at roughly 20.4% for the period. This consistent profitability underscores the scale of its operations across diverse global markets.
As of its December 2025 balance sheet, the firm reported a debt-to-equity ratio of nearly 2.6x. This ratio measures total debt against shareholder equity, with a higher number indicating more reliance on borrowed funds to finance growth. The current ratio, which compares short-term ****** ets to short-term liabilities, was approximately 0.5x, while free cash flow reached a negative $147.8 billion. Free cash flow is the cash a company generates after accounting for cash outflows to support operations and maintain its capital ****** ets.
#sofi #global #term


2 months ago
Investors were quick to pull money out of spot Bitcoin (CRYPTO: $BTC) exchange-traded funds (ETFs) after the Clarity Act failed to advance in the U.S. Senate.
Market data shows that a dozen Bitcoin ETFs in the U.S. saw outflows of $450 million U.S. on Sept. 15, the biggest one-day redemption since June 25th of this year.
The outflows came shortly after the U.S. Senate declined to advance the "Digital **** et Market Clarity Act" that would provide a regulatory framework for cryptocurrencies.
More From Cryptoprowl:
MEXC Launches Earn Plus With Limited-Time Event Offering Up to 800% APR Booster
#outflows #sept
Market data shows that a dozen Bitcoin ETFs in the U.S. saw outflows of $450 million U.S. on Sept. 15, the biggest one-day redemption since June 25th of this year.
The outflows came shortly after the U.S. Senate declined to advance the "Digital **** et Market Clarity Act" that would provide a regulatory framework for cryptocurrencies.
More From Cryptoprowl:
MEXC Launches Earn Plus With Limited-Time Event Offering Up to 800% APR Booster
#outflows #sept


2 months ago
On August 4, Hamilton Lane (NASDAQ:HLNE) posted a first fiscal quarter that showed just how far the private markets manager has scaled. Revenue jumped 56% year over year to $275.3 million, fee-related earnings climbed 49% to $124.5 million, and the firm's total ******* et footprint pushed past $1.1 trillion. That kind of quarter would normally be the whole story. Instead, it came wrapped around three separate balance sheet payouts and a candid admission that client flows have gotten choppier than the headline numbers suggest.
Hamilton Lane's specialized funds are doing the heavy lifting. Fee-earning ******* ets under management in that category grew 25% year over year to $42.6 billion, and that mix shift toward higher-fee products pushed the blended fee rate up to 69 basis points. Management and advisory fees rose 21% to $161.4 million, and FRE margin expanded to 53% from 51% a year earlier, a sign the extra revenue is reaching the bottom line rather than getting absorbed by costs.
The Evergreen platform, Hamilton Lane's semi-liquid product line built for individual and smaller institutional investors, generated $640 million of net inflows and ended the quarter with $19 billion in ******* ets. Ten of twelve funds took in net new money, and none of them needed to gate redemptions even as the broader alternatives industry has wrestled with liquidity questions. The company also added six senior Evergreen sales professionals poached from Fidelity, BlackRock, PIMCO, JPMorgan, Morgan Stanley and Monroe Capital, and just landed its multi-strategy equity fund on a third wirehouse platform.
Fundraising on the closed-end side was equally strong. The sixth direct equity fund closed at $3.8 billion combined, 57% larger than its predecessor, while the seventh secondary fund and second venture fund each held first closes, at $1.3 billion and $370 million. On top of that, Hamilton Lane is set to book roughly $33 million in combined gains from monetizing its stakes in Russell Investments and Canoe, on top of a newly public stake in Securitize.
Not every part of the story is clean. Hamilton Lane's non-US multi-strategy equity fund swung to net outflows for the quarter, and management pointed to a broader hesitancy taking hold. Co-CEO Erik Hirsch acknowledged "a slowdown in flows on certain products and the general hesitancy with investors," a rare moment of candor from a company that otherwise leaned on strong numbers.
#fund #lane
Hamilton Lane's specialized funds are doing the heavy lifting. Fee-earning ******* ets under management in that category grew 25% year over year to $42.6 billion, and that mix shift toward higher-fee products pushed the blended fee rate up to 69 basis points. Management and advisory fees rose 21% to $161.4 million, and FRE margin expanded to 53% from 51% a year earlier, a sign the extra revenue is reaching the bottom line rather than getting absorbed by costs.
The Evergreen platform, Hamilton Lane's semi-liquid product line built for individual and smaller institutional investors, generated $640 million of net inflows and ended the quarter with $19 billion in ******* ets. Ten of twelve funds took in net new money, and none of them needed to gate redemptions even as the broader alternatives industry has wrestled with liquidity questions. The company also added six senior Evergreen sales professionals poached from Fidelity, BlackRock, PIMCO, JPMorgan, Morgan Stanley and Monroe Capital, and just landed its multi-strategy equity fund on a third wirehouse platform.
Fundraising on the closed-end side was equally strong. The sixth direct equity fund closed at $3.8 billion combined, 57% larger than its predecessor, while the seventh secondary fund and second venture fund each held first closes, at $1.3 billion and $370 million. On top of that, Hamilton Lane is set to book roughly $33 million in combined gains from monetizing its stakes in Russell Investments and Canoe, on top of a newly public stake in Securitize.
Not every part of the story is clean. Hamilton Lane's non-US multi-strategy equity fund swung to net outflows for the quarter, and management pointed to a broader hesitancy taking hold. Co-CEO Erik Hirsch acknowledged "a slowdown in flows on certain products and the general hesitancy with investors," a rare moment of candor from a company that otherwise leaned on strong numbers.
#fund #lane


2 months ago
Sept 4 (Reuters) - Global money market funds attracted significant inflows in the week through September 2, as escalating U.S.-Iran tensions and a selloff in global bonds prompted investors to increase cash holdings and favour shorter-duration debt.
Investors added a net $46.1 billion to global money market funds, the biggest weekly inflow since August 5, according to LSEG Lipper data.
The United States struck Iranian military targets near the Strait of Hormuz, while Tehran said it had targeted U.S. **** ets across the region. Brent crude climbed to a nearly 1-1/2-month high of $97.62 a barrel, adding to inflation concerns.
Rate worries also resurfaced after Federal Reserve Chair Kevin Warsh said last week that the central bank would "have work to do" if policymakers were not confident underlying inflation was returning to its 2% target.
Meanwhile, global equity funds attracted net inflows of $6.65 billion, more than reversing the previous week's $6.13 billion in outflows.
#billion #investors #attracted #inflation
Investors added a net $46.1 billion to global money market funds, the biggest weekly inflow since August 5, according to LSEG Lipper data.
The United States struck Iranian military targets near the Strait of Hormuz, while Tehran said it had targeted U.S. **** ets across the region. Brent crude climbed to a nearly 1-1/2-month high of $97.62 a barrel, adding to inflation concerns.
Rate worries also resurfaced after Federal Reserve Chair Kevin Warsh said last week that the central bank would "have work to do" if policymakers were not confident underlying inflation was returning to its 2% target.
Meanwhile, global equity funds attracted net inflows of $6.65 billion, more than reversing the previous week's $6.13 billion in outflows.
#billion #investors #attracted #inflation


2 months ago
In Bitcoin ETF news today, US spot ETFs posted approximately $236.46M in net outflows on September 1, wiping out the previous session's $216.70 million inflow in a single trading day. The reversal landed just as BTC price briefly dipped below $77,000, having traded above $80,000 as recently as late August.
At the time this data was reported, BTC traded near $77,900.00, up +1.3% on the day, a sign the drop wasn't a rout but rather a pause after a bullish month that saw Bitcoin move up +23%.
August was the strongest month of 2026 for Bitcoin ETFs by a wide margin, yet September opened with the largest daily outflow since July 31. One number doesn't cancel the other, but it does raise the question of whether institutional demand is cooling or just catching its breath.
August wasn't a fluke session – it was a month-long accumulation. According to SoSoValue data cited in the primary reporting, US spot Bitcoin ETFs pulled in roughly $3.52Bn in net inflows, dwarfing July's approximately $172M. Bitcoin itself gained about +25% over the same stretch, its best monthly performance since November 2024.
The funds posted inflows in 16 of August's 21 trading sessions, anchored by a nine-day streak from August 17 through August 27, as detailed in coverage of that inflow streak.
#month #spot #posted
At the time this data was reported, BTC traded near $77,900.00, up +1.3% on the day, a sign the drop wasn't a rout but rather a pause after a bullish month that saw Bitcoin move up +23%.
August was the strongest month of 2026 for Bitcoin ETFs by a wide margin, yet September opened with the largest daily outflow since July 31. One number doesn't cancel the other, but it does raise the question of whether institutional demand is cooling or just catching its breath.
August wasn't a fluke session – it was a month-long accumulation. According to SoSoValue data cited in the primary reporting, US spot Bitcoin ETFs pulled in roughly $3.52Bn in net inflows, dwarfing July's approximately $172M. Bitcoin itself gained about +25% over the same stretch, its best monthly performance since November 2024.
The funds posted inflows in 16 of August's 21 trading sessions, anchored by a nine-day streak from August 17 through August 27, as detailed in coverage of that inflow streak.
#month #spot #posted


2 months ago
The cost of holding ETFs has fallen for years amid an intense fee war among issuers. Single-digit expense ratios are commonplace now, and in some cases even those look expensive, like the 0.09% charged by the SPDR S&P 500 ETF Trust (SPY), triple what some competitors charge for the same exposure.
All this is unequivocally great news for investors, but for ETF issuers, not so much. As expense ratios drop, so do the revenues those funds generate, and in most cases, there is little issuers can do about it. Failing to lower fees can lead to hefty outflows, as cost-conscious investors and fiduciary-bound advisors gravitate to cheaper funds.
Case in point: SPY has lost a lot of ****** ets over the years to the Vanguard S&P 500 ETF (VOO) and the iShares Core S&P 500 ETF (IVV), two cheaper funds tracking the same index. VOO has since grown into the largest ETF in the world, at more than $1 trillion in AUM.
Even in a price war, the victors take hits. The cheapest ETFs may gather the most ****** ets, but that is often more than offset by the decline in fees. On the list of the biggest ETF cash cows, only a handful of funds are ultra-cheap. Many more are expensive by ETF standards.
The table below lists the 20 ETFs with the highest implied revenue, an approximation of how much money a fund generates for its issuer, derived by multiplying ****** ets under management by the expense ratio.
#funds
All this is unequivocally great news for investors, but for ETF issuers, not so much. As expense ratios drop, so do the revenues those funds generate, and in most cases, there is little issuers can do about it. Failing to lower fees can lead to hefty outflows, as cost-conscious investors and fiduciary-bound advisors gravitate to cheaper funds.
Case in point: SPY has lost a lot of ****** ets over the years to the Vanguard S&P 500 ETF (VOO) and the iShares Core S&P 500 ETF (IVV), two cheaper funds tracking the same index. VOO has since grown into the largest ETF in the world, at more than $1 trillion in AUM.
Even in a price war, the victors take hits. The cheapest ETFs may gather the most ****** ets, but that is often more than offset by the decline in fees. On the list of the biggest ETF cash cows, only a handful of funds are ultra-cheap. Many more are expensive by ETF standards.
The table below lists the 20 ETFs with the highest implied revenue, an approximation of how much money a fund generates for its issuer, derived by multiplying ****** ets under management by the expense ratio.
#funds


2 months ago
Investors added $27.2 billion to US-listed ETFs during the week ending Friday, Aug. 28, pushing year-to-date inflows to $1.38 trillion.
International equity ETFs led the way with $9.1 billion, followed by US fixed income ETFs with $8.6 billion. US equity ETFs took in a relatively modest $2.3 billion, less even than the $2.5 billion that went into currency funds.
The backdrop was a firmer stock market and a softer bond market. The S&P 500 rose about 1% last week, while the 10-year Treasury yield ticked a few basis points higher. On Monday it climbed further, reaching as much as 4.77%, its highest level since January 2025.
Judging by the flows, ETF investors have been treating those higher yields as a buying opportunity.
At the individual fund level, the Vanguard S&P 500 ETF (VOO) led with $11.4 billion, lifting its year-to-date haul to a whopping $106 billion. The Vanguard Short-Term Treasury ETF (VGSH) followed with $2.7 billion.
Meanwhile, both the AI trade and the debasement trade remained in play, with $1.6 billion flowing into the VanEck Semiconductor ETF (SMH) and $1.2 billion into the iShares Bitcoin Trust ETF (IBIT).
For a full list of last week's top inflows and outflows, see the tables below.
Ticker
Name
Net Flows ($, mm)
AUM ($, mm)
#etfs #vanguard #flows #week
International equity ETFs led the way with $9.1 billion, followed by US fixed income ETFs with $8.6 billion. US equity ETFs took in a relatively modest $2.3 billion, less even than the $2.5 billion that went into currency funds.
The backdrop was a firmer stock market and a softer bond market. The S&P 500 rose about 1% last week, while the 10-year Treasury yield ticked a few basis points higher. On Monday it climbed further, reaching as much as 4.77%, its highest level since January 2025.
Judging by the flows, ETF investors have been treating those higher yields as a buying opportunity.
At the individual fund level, the Vanguard S&P 500 ETF (VOO) led with $11.4 billion, lifting its year-to-date haul to a whopping $106 billion. The Vanguard Short-Term Treasury ETF (VGSH) followed with $2.7 billion.
Meanwhile, both the AI trade and the debasement trade remained in play, with $1.6 billion flowing into the VanEck Semiconductor ETF (SMH) and $1.2 billion into the iShares Bitcoin Trust ETF (IBIT).
For a full list of last week's top inflows and outflows, see the tables below.
Ticker
Name
Net Flows ($, mm)
AUM ($, mm)
#etfs #vanguard #flows #week


2 months ago
Bloomberg senior ETF ******* yst Eric Balchunas says the "debasement trade" is increasingly stealing attention from artificial intelligence, pointing to record demand for gold and Bitcoin exchange-traded funds.
"Gold and Bitcoin ETFs have combined for +$7b in flows in past week, by far a record for a 5-day period as debasement trade steals spotlight from AI," Balchunas wrote on X on Aug. 26.
He said SPDR Gold Shares (GLD) and BlackRock's iShares Bitcoin Trust (IBIT) led the move, with both ranking among the 10 most-traded ETFs over the week.
Balchunas also noted that IBIT's year-to-date flows had turned positive after recovering from earlier outflows.
The latest comment builds on a post a day earlier, when Balchunas said GLD and IBIT had returned to the top 10 most-traded ETFs while semiconductor funds, which dominated much of the summer, slipped down the rankings.
#Bitcoin #traded #ibit
"Gold and Bitcoin ETFs have combined for +$7b in flows in past week, by far a record for a 5-day period as debasement trade steals spotlight from AI," Balchunas wrote on X on Aug. 26.
He said SPDR Gold Shares (GLD) and BlackRock's iShares Bitcoin Trust (IBIT) led the move, with both ranking among the 10 most-traded ETFs over the week.
Balchunas also noted that IBIT's year-to-date flows had turned positive after recovering from earlier outflows.
The latest comment builds on a post a day earlier, when Balchunas said GLD and IBIT had returned to the top 10 most-traded ETFs while semiconductor funds, which dominated much of the summer, slipped down the rankings.
#Bitcoin #traded #ibit

2 months ago
On August 20, Futu Holdings Limited (NASDAQ:FUTU) reported the strongest quarter in its history, with trading volume pushing past HK$6 trillion for the first time. Buried inside those numbers, though, is a reminder that the company's oldest and largest client base isn't as untouchable as it once looked, with **** et outflows tied to new compliance rules. The result is a business firing on nearly every cylinder except the one investors have relied on the longest.
Futu's headline numbers back up the enthusiasm. Total revenue climbed 35.6% year over year to HK$7.2 billion, while net income jumped 41.6% to HK$3.6 billion, pushing net margin to 50.6%. Total trading volume rose 78.8% year over year to a record HK$6.42 trillion, with U.S. stock trading volume up 67.2% sequentially to HK$5.02 trillion as clients piled into semiconductor and artificial intelligence names. Client **** ets grew even faster than trading activity, up 43.6% year over year to HK$1.4 trillion, and margin financing and securities lending balances jumped 85.1% to HK$95.1 billion as an active Hong Kong IPO market encouraged clients to lean on leverage.
The growth isn't confined to trading. Net new funded accounts rose 23.7% year over year to 252,000, led by Malaysia, where the business reached operating breakeven for the first time. Futu also picked up a Type A securities license from Thailand's regulator, its third market launch in the ASEAN region, and became the first Hong Kong broker approved for securities-backed margin financing tied to virtual **** ets under an upgraded Type 1 license. In the U.S., moomoo's newly launched prediction markets generated more than $200 million in trade volume in their first month, while Futu's IPO business served nearly 60% of new Hong Kong listings during the quarter.
Not every part of the story is expanding. Chairman Leaf Li acknowledged that **** ulative **** et outflows tied to new regulations came to a mid-single-digit percentage of total client **** ets, the result of compliance-driven adjustments and risk-off sentiment among the company's Mainland Chinese clients. Growth is also getting more expensive to buy. Customer acquisition cost rose sequentially to HK$2,600 as new regulatory developments weighed on net new funded accounts.
Profitability showed some strain too, with gross margin slipping to 86.3% from 87.4% a year earlier as processing and cloud service fees increased, while operating expenses rose 35.1% year over year as research and development, selling and marketing, and general administrative costs all climbed on investments in AI, Web 3 initiatives, and international expansion. Even the brokerage business had a trade-off, as blended commission rates fell because a larger share of trading shifted into lower-margin U.S. stocks and options.
#Margin
Futu's headline numbers back up the enthusiasm. Total revenue climbed 35.6% year over year to HK$7.2 billion, while net income jumped 41.6% to HK$3.6 billion, pushing net margin to 50.6%. Total trading volume rose 78.8% year over year to a record HK$6.42 trillion, with U.S. stock trading volume up 67.2% sequentially to HK$5.02 trillion as clients piled into semiconductor and artificial intelligence names. Client **** ets grew even faster than trading activity, up 43.6% year over year to HK$1.4 trillion, and margin financing and securities lending balances jumped 85.1% to HK$95.1 billion as an active Hong Kong IPO market encouraged clients to lean on leverage.
The growth isn't confined to trading. Net new funded accounts rose 23.7% year over year to 252,000, led by Malaysia, where the business reached operating breakeven for the first time. Futu also picked up a Type A securities license from Thailand's regulator, its third market launch in the ASEAN region, and became the first Hong Kong broker approved for securities-backed margin financing tied to virtual **** ets under an upgraded Type 1 license. In the U.S., moomoo's newly launched prediction markets generated more than $200 million in trade volume in their first month, while Futu's IPO business served nearly 60% of new Hong Kong listings during the quarter.
Not every part of the story is expanding. Chairman Leaf Li acknowledged that **** ulative **** et outflows tied to new regulations came to a mid-single-digit percentage of total client **** ets, the result of compliance-driven adjustments and risk-off sentiment among the company's Mainland Chinese clients. Growth is also getting more expensive to buy. Customer acquisition cost rose sequentially to HK$2,600 as new regulatory developments weighed on net new funded accounts.
Profitability showed some strain too, with gross margin slipping to 86.3% from 87.4% a year earlier as processing and cloud service fees increased, while operating expenses rose 35.1% year over year as research and development, selling and marketing, and general administrative costs all climbed on investments in AI, Web 3 initiatives, and international expansion. Even the brokerage business had a trade-off, as blended commission rates fell because a larger share of trading shifted into lower-margin U.S. stocks and options.
#Margin

2 months ago
Investors poured more than $56 billion into US-listed ETFs during the week ending Aug. 21, lifting year-to-date inflows past $1.3 trillion.
US equity ETFs took in about half the total at $25 billion. US fixed income added $12.5 billion, international equity funds gathered $5.6 billion, and international fixed income took in $2.5 billion.
Commodity ETFs were the notable standout, pulling in almost $5 billion, while currency funds at $2.2 billion and alternatives at $2.8 billion also had strong weeks.
The S&P 500 slipped a little over 1% last week, pulling back from the record highs it had set the week before. Bonds stayed under pressure even after the Treasury Department moved to support the market, announcing it would double the size of its long-dated debt buybacks.
Yields fell briefly on the news but quickly reversed, leaving the 30-year Treasury yield not far from the 19-year high above 5.3% it reached on Aug. 17.
The Treasury's attempts to keep long-term yields down revived the so-called debasement trade. The SPDR Gold Shares (GLD) took in $3.4 billion and the iShares Bitcoin Trust (IBIT) added more than $1 billion as both gold and bitcoin spiked. Gold is now back in the green, up around 8% on the year after spending much of the summer underwater. IBIT remains down about 10% in 2026, though that is a marked improvement from the 33% loss it was nursing at its worst point in June.
On the other side of the ledger, the VanEck Semiconductor ETF (SMH) led outflows, shedding $1.7 billion. Semiconductor stocks have been treading water lately, chopping up and down after starting the third quarter under pressure.
The broader AI trade remains intact, but it has grown increasingly volatile as investors go back and forth over whether the rally is sustainable and whether the group has already peaked.
For a full list of last week's top inflows and outflows, see the tables below
Ticker
Name
Net Flows ($, mm)
AUM ($, mm)
#etfs #year #took #down
US equity ETFs took in about half the total at $25 billion. US fixed income added $12.5 billion, international equity funds gathered $5.6 billion, and international fixed income took in $2.5 billion.
Commodity ETFs were the notable standout, pulling in almost $5 billion, while currency funds at $2.2 billion and alternatives at $2.8 billion also had strong weeks.
The S&P 500 slipped a little over 1% last week, pulling back from the record highs it had set the week before. Bonds stayed under pressure even after the Treasury Department moved to support the market, announcing it would double the size of its long-dated debt buybacks.
Yields fell briefly on the news but quickly reversed, leaving the 30-year Treasury yield not far from the 19-year high above 5.3% it reached on Aug. 17.
The Treasury's attempts to keep long-term yields down revived the so-called debasement trade. The SPDR Gold Shares (GLD) took in $3.4 billion and the iShares Bitcoin Trust (IBIT) added more than $1 billion as both gold and bitcoin spiked. Gold is now back in the green, up around 8% on the year after spending much of the summer underwater. IBIT remains down about 10% in 2026, though that is a marked improvement from the 33% loss it was nursing at its worst point in June.
On the other side of the ledger, the VanEck Semiconductor ETF (SMH) led outflows, shedding $1.7 billion. Semiconductor stocks have been treading water lately, chopping up and down after starting the third quarter under pressure.
The broader AI trade remains intact, but it has grown increasingly volatile as investors go back and forth over whether the rally is sustainable and whether the group has already peaked.
For a full list of last week's top inflows and outflows, see the tables below
Ticker
Name
Net Flows ($, mm)
AUM ($, mm)
#etfs #year #took #down


2 months ago
Solana's real-world-asset ecosystem crossed $4 billion in total value on August 23, according to a post from the official Solana account. The milestone came two days after validators activated SIMD-0525 at epoch 1020, cutting the network's slot time from 400 milliseconds to 350 milliseconds for the first time since launch.
In the six days before epoch 1020, Solana Compass network ***** ytics recorded average user throughput of 1,710 transactions per second and 27.7% compute utilization against the 400ms block ceiling.
DISCOVER: Best Meme Coins to Buy in 2026
Motley Fool's ***** ysis of the 30 days ending August 19 put Solana's RWA inflows at $263 million, while Ethereum's RWA ecosystem recorded $337 million in outflows over the same window. The report put Solana's 30-day growth rate at 10.6%, compared with Ethereum's 1.3%.
Tokenized U.S. Treasury products accounted for $1.2 billion of Solana's reported RWA ecosystem total, up 16.1% over the same period, according to the same report. Backed Finance's xStocks product offers more than 60 U.S. stocks and ETFs as SPL tokens, with trading available on Raydium, Jupiter, and Kamino Finance.
#Solana #time
In the six days before epoch 1020, Solana Compass network ***** ytics recorded average user throughput of 1,710 transactions per second and 27.7% compute utilization against the 400ms block ceiling.
DISCOVER: Best Meme Coins to Buy in 2026
Motley Fool's ***** ysis of the 30 days ending August 19 put Solana's RWA inflows at $263 million, while Ethereum's RWA ecosystem recorded $337 million in outflows over the same window. The report put Solana's 30-day growth rate at 10.6%, compared with Ethereum's 1.3%.
Tokenized U.S. Treasury products accounted for $1.2 billion of Solana's reported RWA ecosystem total, up 16.1% over the same period, according to the same report. Backed Finance's xStocks product offers more than 60 U.S. stocks and ETFs as SPL tokens, with trading available on Raydium, Jupiter, and Kamino Finance.
#Solana #time


2 months ago
(Corrects Aug 20 story in paragraph 5 to remove erroneous reference to Julius Baer)
By Summer Zhen, Selena Li and Xinghui Kok
HONG KONG/SINGAPORE, Aug 20 (Reuters) - A growing campaign to tax offshore wealth is forcing wealthy Chinese people to rethink their trust structures and investment holdings, lawyers and advisers say, as Beijing sharpens its focus on capital outflows and rule enforcement amid growing fiscal strains.
In late July, authorities overhauled rules to impose a 20% income tax on offshore trusts, while tax offices in major cities like Beijing and Hangzhou have started to enforce taxation on returns from offshore insurance policies.
Those measures have triggered a scramble among some wealthy individuals to ***** s their liabilities, raise cash to meet them and revamp investment holdings. They have also fuelled concern that Beijing may widen its tax crackdown and scrutiny of offshore wealth.
#wealth #wealthy #investment
By Summer Zhen, Selena Li and Xinghui Kok
HONG KONG/SINGAPORE, Aug 20 (Reuters) - A growing campaign to tax offshore wealth is forcing wealthy Chinese people to rethink their trust structures and investment holdings, lawyers and advisers say, as Beijing sharpens its focus on capital outflows and rule enforcement amid growing fiscal strains.
In late July, authorities overhauled rules to impose a 20% income tax on offshore trusts, while tax offices in major cities like Beijing and Hangzhou have started to enforce taxation on returns from offshore insurance policies.
Those measures have triggered a scramble among some wealthy individuals to ***** s their liabilities, raise cash to meet them and revamp investment holdings. They have also fuelled concern that Beijing may widen its tax crackdown and scrutiny of offshore wealth.
#wealth #wealthy #investment

3 months ago
The Grayscale XRP Trust ETF has sold XRP worth more than $180 million during the first half of 2026, the latest filing with the U.S. Securities and Exchange Commission (SEC) revealed.
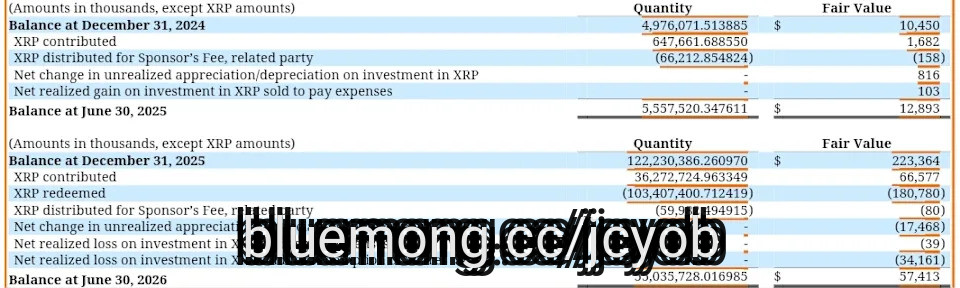
The fund held 122.23 million XRP by the end of 2025 but lowered the holdings to 55.04 million XRP as of June 30, 2026.
The trust cashed out $180.78 million worth of XRP, selling 103.41 million tokens to redeem investor ****** ets.
Related: XRP holders can now borrow Ripple's stablecoin
The trust created an additional 36.27 million in XRP worth $66.58 million during the last six months. But the outflows exceeded the inflows.
#commission
The fund held 122.23 million XRP by the end of 2025 but lowered the holdings to 55.04 million XRP as of June 30, 2026.
The trust cashed out $180.78 million worth of XRP, selling 103.41 million tokens to redeem investor ****** ets.
Related: XRP holders can now borrow Ripple's stablecoin
The trust created an additional 36.27 million in XRP worth $66.58 million during the last six months. But the outflows exceeded the inflows.
#commission

3 months ago
The European banking sector is facing a re-rating this year, led by a "higher for longer" interest rate environment that continues to enhance net interest margins across core lending books. The doubling of the EURO STOXX Banks Index in the last two years represents a substantial adjustment in investor opinion, turning European financials from a chronically punished sector into a core part of macro risk appetite. Europe's flagship institutions, UBS Group AG (NYSE:UBS) and Deutsche Bank Aktiengesellschaft (NYSE:DB), are providing profitability on par with top-tier Wall Street investment banks, thanks to rising trading volatility, active customer engagement and wider deposit spreads.
Deutsche Bank Aktiengesellschaft (NYSE:DB) reported a record post-tax profit of €1.9 billion in the second quarter of 2026, while overall net revenues increased 9% year-over-year to €8.5 billion, boosting pre-tax profit by 11% to €2.7 billion. The lender's performance was driven by its reinvigorated Investment Bank, which saw pre-tax profit rise 59% year-over-year to €1.3 billion. Operating performance was especially strong in fixed income, rates, and credit trading, where Deutsche Bank outperformed several key US competitors.
Additionally, Deutsche Bank Aktiengesellschaft (NYSE:DB) is proving that its multiyear operational change is gaining traction ahead of its long-term corporate goals. Management intends to achieve a 60% cost-income ratio and a 13% return on tangible equity (ROTE) by 2028. In the initial half of 2026, the bank reached a 60.9% cost-income ratio and an 11.9% ROTE, indicating that its cost-discipline framework and revenue trends are ahead of projections.
UBS Group AG (NYSE:UBS) matched its German counterpart by reporting extraordinary second-quarter results, including a pre-tax profit of $3.6 billion and an underlying pre-tax profit of $3.9 billion, a 47% increase year-over-year. While CEO Sergio Ermotti described the Investment Bank's performance as exceptional, he cautioned that rising macroeconomic threats might quickly shift market sentiment.
The wealth management division added $36 billion in net new ****** ets during the quarter. Notably, the company produced positive net inflows in the Americas while absorbing around $10 billion in seasonal US tax-related ****** et outflows. Moreover, UBS's "one bank" cross-divisional strategy in Asia-Pacific generated almost one-third of the group's pre-tax profit while capturing significant wealth inflows. Adding to bottom-line execution, UBS Group AG (NYSE:UBS) realized an additional $1.1 billion in run-rate cost savings during Q2 from its continued integration of Credit Suisse, bringing total gross cost reductions to $12.6 billion as the merger nears completion.
#billion
Deutsche Bank Aktiengesellschaft (NYSE:DB) reported a record post-tax profit of €1.9 billion in the second quarter of 2026, while overall net revenues increased 9% year-over-year to €8.5 billion, boosting pre-tax profit by 11% to €2.7 billion. The lender's performance was driven by its reinvigorated Investment Bank, which saw pre-tax profit rise 59% year-over-year to €1.3 billion. Operating performance was especially strong in fixed income, rates, and credit trading, where Deutsche Bank outperformed several key US competitors.
Additionally, Deutsche Bank Aktiengesellschaft (NYSE:DB) is proving that its multiyear operational change is gaining traction ahead of its long-term corporate goals. Management intends to achieve a 60% cost-income ratio and a 13% return on tangible equity (ROTE) by 2028. In the initial half of 2026, the bank reached a 60.9% cost-income ratio and an 11.9% ROTE, indicating that its cost-discipline framework and revenue trends are ahead of projections.
UBS Group AG (NYSE:UBS) matched its German counterpart by reporting extraordinary second-quarter results, including a pre-tax profit of $3.6 billion and an underlying pre-tax profit of $3.9 billion, a 47% increase year-over-year. While CEO Sergio Ermotti described the Investment Bank's performance as exceptional, he cautioned that rising macroeconomic threats might quickly shift market sentiment.
The wealth management division added $36 billion in net new ****** ets during the quarter. Notably, the company produced positive net inflows in the Americas while absorbing around $10 billion in seasonal US tax-related ****** et outflows. Moreover, UBS's "one bank" cross-divisional strategy in Asia-Pacific generated almost one-third of the group's pre-tax profit while capturing significant wealth inflows. Adding to bottom-line execution, UBS Group AG (NYSE:UBS) realized an additional $1.1 billion in run-rate cost savings during Q2 from its continued integration of Credit Suisse, bringing total gross cost reductions to $12.6 billion as the merger nears completion.
#billion


3 months ago
Investors in 2026 face a clear choice between a speculative hydrogen pioneer and a profitable oil giant. Plug Power (NASDAQ:PLUG) and Occidental Petroleum (NYSE:OXY) represent two very different paths in the evolving energy landscape.
Plug Power focuses on the future of green hydrogen and fuel-cell technology, while Occidental Petroleum produces traditional energy while investing in carbon capture. They are compared because they offer different ways to play the energy transition.
Plug Power builds green hydrogen and fuel-cell solutions for global industrial applications. The company focuses on large-scale logistics, providing fuel to the material handling and e-mobility sectors. Walmart is a major customer, representing roughly 24.2% of consolidated revenues as of late 2025, adding a layer of risk to the business.
In FY 2025, revenue reached nearly $709.9 million, reflecting a growth rate of approximately 12.9% over the previous year. Despite this growth, the company reported a net loss of approximately $1.6 billion for the same period. This resulted in a net margin of -229.8%, highlighting the significant costs involved in scaling hydrogen production.
As of its December 2025 balance sheet, the debt-to-equity ratio was 1.0x. This metric, which measures a company's total debt against its shareholder equity, sits at 1.0x, while a current ratio of 2.3x indicates the company has enough short-term **** ets to cover immediate liabilities. However, free cash flow was negative $661.5 million in FY 2025, meaning cash outflows exceeded inflows from operations and capital investments.
#power #fuel
Plug Power focuses on the future of green hydrogen and fuel-cell technology, while Occidental Petroleum produces traditional energy while investing in carbon capture. They are compared because they offer different ways to play the energy transition.
Plug Power builds green hydrogen and fuel-cell solutions for global industrial applications. The company focuses on large-scale logistics, providing fuel to the material handling and e-mobility sectors. Walmart is a major customer, representing roughly 24.2% of consolidated revenues as of late 2025, adding a layer of risk to the business.
In FY 2025, revenue reached nearly $709.9 million, reflecting a growth rate of approximately 12.9% over the previous year. Despite this growth, the company reported a net loss of approximately $1.6 billion for the same period. This resulted in a net margin of -229.8%, highlighting the significant costs involved in scaling hydrogen production.
As of its December 2025 balance sheet, the debt-to-equity ratio was 1.0x. This metric, which measures a company's total debt against its shareholder equity, sits at 1.0x, while a current ratio of 2.3x indicates the company has enough short-term **** ets to cover immediate liabilities. However, free cash flow was negative $661.5 million in FY 2025, meaning cash outflows exceeded inflows from operations and capital investments.
#power #fuel


3 months ago
US spot Bitcoin ETFs recorded $206M in net inflows on July 21, per data tracked by CoinGlass, completing a six-consecutive-day run that totals more than $900M, the longest unbroken positive streak since May.
This inflow streak comes as the Bitcoin price reclaimed the $66,000 level (which it has since lost) and market sentiment entered neutral territory for the first time in nearly a month.
(SOURCE: CoinGlass)
This is not simply a rebound in ETF flows. It is a structural re-engagement by institutional capital following one of the more damaging periods of outflows the Bitcoin ETF complex has endured since its January 2024 launch.
The **** ytical question is no longer whether June's selling pressure has exhausted itself; it is whether the current inflow cadence is durable enough to shift the medium-term supply-demand balance.
#coinglass #whether #july
This inflow streak comes as the Bitcoin price reclaimed the $66,000 level (which it has since lost) and market sentiment entered neutral territory for the first time in nearly a month.
(SOURCE: CoinGlass)
This is not simply a rebound in ETF flows. It is a structural re-engagement by institutional capital following one of the more damaging periods of outflows the Bitcoin ETF complex has endured since its January 2024 launch.
The **** ytical question is no longer whether June's selling pressure has exhausted itself; it is whether the current inflow cadence is durable enough to shift the medium-term supply-demand balance.
#coinglass #whether #july


3 months ago
Some offers on this page are from advertisers who pay us, which may affect which products we write about, but not our recommendations. See our Advertiser Disclosure.
Bitcoin (BTC-USD) opened at $65,214.10 on Tuesday, July 21, 2026, 0.8% higher than Monday's opening price. As of 9:30 a.m. ET this morning, the price of bitcoin moved up to $66,398.15.
Ethereum (ETH-USD) opened at $1,903.35 on Tuesday, July 21, 2026, up 1.7% from Monday's opening price. The price of ethereum moved higher this morning to $1,935.99 as of 9:30 a.m. ET.
Bitcoin and ethereum opened higher this morning. Investors' appetite for risk has returned momentarily; strength in crypto coincided with an uptick in the tech-heavy Nasdaq-100 (^NDX) this morning.
The trend may be more than a one-day blip. According to SoSo Value data, the last week marked the second consecutive week bitcoin ETFs had positive net inflows, for the first time since May. The inflows did not cover the outflows over the past several weeks.
#ethereum #opened #tuesday
Bitcoin (BTC-USD) opened at $65,214.10 on Tuesday, July 21, 2026, 0.8% higher than Monday's opening price. As of 9:30 a.m. ET this morning, the price of bitcoin moved up to $66,398.15.
Ethereum (ETH-USD) opened at $1,903.35 on Tuesday, July 21, 2026, up 1.7% from Monday's opening price. The price of ethereum moved higher this morning to $1,935.99 as of 9:30 a.m. ET.
Bitcoin and ethereum opened higher this morning. Investors' appetite for risk has returned momentarily; strength in crypto coincided with an uptick in the tech-heavy Nasdaq-100 (^NDX) this morning.
The trend may be more than a one-day blip. According to SoSo Value data, the last week marked the second consecutive week bitcoin ETFs had positive net inflows, for the first time since May. The inflows did not cover the outflows over the past several weeks.
#ethereum #opened #tuesday



3 months ago
Some offers on this page are from advertisers who pay us, which may affect which products we write about, but not our recommendations. See our Advertiser Disclosure.
Bitcoin (BTC-USD) opened at $65,214.10 on Tuesday, July 21, 2026, 0.8% higher than Monday's opening price. As of 9:30 a.m. ET this morning, the price of bitcoin moved up to $66,398.15.
Ethereum (ETH-USD) opened at $1,903.35 on Tuesday, July 21, 2026, up 1.7% from Monday's opening price. The price of ethereum moved higher this morning to $1,935.99 as of 9:30 a.m. ET.
Bitcoin and ethereum opened higher this morning. Investors' appetite for risk has returned momentarily; strength in crypto coincided with an uptick in the tech-heavy Nasdaq-100 (^NDX) this morning.
The trend may be more than a one-day blip. According to SoSo Value data, the last week marked the second consecutive week bitcoin ETFs had positive net inflows, for the first time since May. The inflows did not cover the outflows over the past several weeks.
#july
Bitcoin (BTC-USD) opened at $65,214.10 on Tuesday, July 21, 2026, 0.8% higher than Monday's opening price. As of 9:30 a.m. ET this morning, the price of bitcoin moved up to $66,398.15.
Ethereum (ETH-USD) opened at $1,903.35 on Tuesday, July 21, 2026, up 1.7% from Monday's opening price. The price of ethereum moved higher this morning to $1,935.99 as of 9:30 a.m. ET.
Bitcoin and ethereum opened higher this morning. Investors' appetite for risk has returned momentarily; strength in crypto coincided with an uptick in the tech-heavy Nasdaq-100 (^NDX) this morning.
The trend may be more than a one-day blip. According to SoSo Value data, the last week marked the second consecutive week bitcoin ETFs had positive net inflows, for the first time since May. The inflows did not cover the outflows over the past several weeks.
#july


3 months ago
Some offers on this page are from advertisers who pay us, which may affect which products we write about, but not our recommendations. See our Advertiser Disclosure.
Bitcoin (BTC-USD) opened at $65,214.10 on Tuesday, July 21, 2026, 0.8% higher than Monday's opening price. As of 9:30 a.m. ET this morning, the price of bitcoin moved up to $66,398.15.
Ethereum (ETH-USD) opened at $1,903.35 on Tuesday, July 21, 2026, up 1.7% from Monday's opening price. The price of ethereum moved higher this morning to $1,935.99 as of 9:30 a.m. ET.
Bitcoin and ethereum opened higher this morning. Investors' appetite for risk has returned momentarily; strength in crypto coincided with an uptick in the tech-heavy Nasdaq-100 (^NDX) this morning.
The trend may be more than a one-day blip. According to SoSo Value data, the last week marked the second consecutive week bitcoin ETFs had positive net inflows, for the first time since May. The inflows did not cover the outflows over the past several weeks.
#Bitcoin #morning #higher
Bitcoin (BTC-USD) opened at $65,214.10 on Tuesday, July 21, 2026, 0.8% higher than Monday's opening price. As of 9:30 a.m. ET this morning, the price of bitcoin moved up to $66,398.15.
Ethereum (ETH-USD) opened at $1,903.35 on Tuesday, July 21, 2026, up 1.7% from Monday's opening price. The price of ethereum moved higher this morning to $1,935.99 as of 9:30 a.m. ET.
Bitcoin and ethereum opened higher this morning. Investors' appetite for risk has returned momentarily; strength in crypto coincided with an uptick in the tech-heavy Nasdaq-100 (^NDX) this morning.
The trend may be more than a one-day blip. According to SoSo Value data, the last week marked the second consecutive week bitcoin ETFs had positive net inflows, for the first time since May. The inflows did not cover the outflows over the past several weeks.
#Bitcoin #morning #higher


4 months ago
Ethereum (ETH) has managed to stay above $1,800 in the past few days. This is a key area that has acted as both support and resistance for the top altcoin for weeks, and that could define its course in the next few days.
In the last 24 hours alone, ETH has advanced by 1.5% after two consecutive days of losses. Market sentiment has recovered considerably compared to a few days ago, as reports indicated that inflation in the United States cooled down a bit in June.
The Crypto Fear and Greed Index currently sits at 34, meaning that investors' attitude has swung from Extreme Fear to the closest it has gotten to "Neutral" territory since the end of May.
Meanwhile, Ethereum-linked exchange-traded funds (ETFs) brought in positive net inflows amounting to $106 million. This indicates that investors' interest in the top altcoin has been recovering, probably as a result of the latest price action.
Overall, monthly net inflows in July have been positive after two consecutive months of net outflows.
In the last 24 hours alone, ETH has advanced by 1.5% after two consecutive days of losses. Market sentiment has recovered considerably compared to a few days ago, as reports indicated that inflation in the United States cooled down a bit in June.
The Crypto Fear and Greed Index currently sits at 34, meaning that investors' attitude has swung from Extreme Fear to the closest it has gotten to "Neutral" territory since the end of May.
Meanwhile, Ethereum-linked exchange-traded funds (ETFs) brought in positive net inflows amounting to $106 million. This indicates that investors' interest in the top altcoin has been recovering, probably as a result of the latest price action.
Overall, monthly net inflows in July have been positive after two consecutive months of net outflows.



4 months ago
SK Hynix dominates the global high-bandwidth memory market and just landed on Nasdaq, giving U.S. investors a fiercer AI memory play than Micron.
More bullish **** ysts project SK Hynix gains of between 100% and 120%, but panic-selling tied to South Korea capital outflows may be premature given sustained AI demand.
Markets now reward CapEx efficiency over brute-force AI spending, making the memory demand bull case more fragile than the data center buildout suggests.
Act now: the **** yst who called NVIDIA in 2010 just named his top 10 AI stocks — and Meta didn't make the cut. Grab the names FREE today.
It took long enough for shares of SK Hynix (NASDAQ:SKHY) to trade on a U.S. exchange. Now that it's landed on the Nasdaq, questions linger as to whether it's a better way to bet on the memory boom than Micron (NASDAQ:MU), the only option that U.S. investors had for the past few years of the AI boom.
More bullish **** ysts project SK Hynix gains of between 100% and 120%, but panic-selling tied to South Korea capital outflows may be premature given sustained AI demand.
Markets now reward CapEx efficiency over brute-force AI spending, making the memory demand bull case more fragile than the data center buildout suggests.
Act now: the **** yst who called NVIDIA in 2010 just named his top 10 AI stocks — and Meta didn't make the cut. Grab the names FREE today.
It took long enough for shares of SK Hynix (NASDAQ:SKHY) to trade on a U.S. exchange. Now that it's landed on the Nasdaq, questions linger as to whether it's a better way to bet on the memory boom than Micron (NASDAQ:MU), the only option that U.S. investors had for the past few years of the AI boom.

4 months ago
UBS advised certain clients to trim oversized private credit positions, prompting investor withdrawals from Blue Owl Technology Income during the fourth quarter of 2025, according to a Financial Times report published on Friday.
The publication, citing two people familiar with the matter, said that at least 60% of the fund's capital had been provided by UBS clients in Asia.
The Financial Times reported that UBS encouraged clients with elevated exposure to private credit investments to rebalance their portfolios, leading to outflows from the Blue Owl Technology Income fund.
UBS declined to comment on the matter when contacted by the Financial Times.
Responding to the report, a spokesperson for Blue Owl (NYSE:OWL) said the fund's underlying credit quality has remained resilient.
The publication, citing two people familiar with the matter, said that at least 60% of the fund's capital had been provided by UBS clients in Asia.
The Financial Times reported that UBS encouraged clients with elevated exposure to private credit investments to rebalance their portfolios, leading to outflows from the Blue Owl Technology Income fund.
UBS declined to comment on the matter when contacted by the Financial Times.
Responding to the report, a spokesperson for Blue Owl (NYSE:OWL) said the fund's underlying credit quality has remained resilient.

4 months ago
CleanSpark Inc. (NASDAQ: $CLSK) remains the most heavily shorted crypto company with a market value above $2 billion, keeping the Bitcoin (CRYPTO: $BTC) miner at the center of a market increasingly divided over the sector's next leg.
Short interest in CleanSpark rose to 33.04% in June from 32.76% a month earlier, the highest level among crypto-linked companies in the group. The reading comes after Bitcoin fell as low as $58,000 during the month and U.S. spot Bitcoin ETFs recorded $4.5 billion in net outflows, their worst monthly total since launching in January 2024.
CleanSpark has continued to grow its Bitcoin treasury even as pressure builds across mining stocks. The company said Tuesday it produced 614 Bitcoin in June and ended the month with 13,924 BTC, up from 13,470 at the end of May.
More From Cryptoprowl:
Ripple, The Company Behind XRP, Is Valued At $50 Billion
Short interest in CleanSpark rose to 33.04% in June from 32.76% a month earlier, the highest level among crypto-linked companies in the group. The reading comes after Bitcoin fell as low as $58,000 during the month and U.S. spot Bitcoin ETFs recorded $4.5 billion in net outflows, their worst monthly total since launching in January 2024.
CleanSpark has continued to grow its Bitcoin treasury even as pressure builds across mining stocks. The company said Tuesday it produced 614 Bitcoin in June and ended the month with 13,924 BTC, up from 13,470 at the end of May.
More From Cryptoprowl:
Ripple, The Company Behind XRP, Is Valued At $50 Billion


4 months ago
Equitable Holdings Inc. (NYSE:EQH) is one of the Top 10 Extreme Value Stocks To Buy Now. Alex Scott of Barclays reaffirmed a Buy rating on Equitable Holdings Inc. (NYSE:EQH) along with the price target of $51 on June 22. The firm's price target implies a further 15% upside from current levels. This price target matches the lowest Wall Street price target among 15 ******* ysts covering the stock.
On a bullish note, UBS ******* yst Michael Ward CFA raised the firm's price target on Equitable Holdings Inc. (NYSE:EQH) from $58 to $63 while keeping a Buy rating on the shares. The ******* yst cited stronger-than-expected ******* et growth and improving investment performance, which he believes will support higher earnings. He also said that the company's ******* ets under management have recovered significantly despite the recent retail outflows. This has brought the combined business close to $1 trillion in ******* ets.
Moreover, Michael Ward highlighted the expected benefits of the planned merger with CRBG. According to the ******* yst, the deal will increase Equitable Holdings' scale, attract a broader investor base, and enhance its chances of joining major stock indexes. Despite concerns over execution, he expects the company to achieve its planned $500 million in cost savings.
Equitable Holdings Inc. (NYSE:EQH) is a financial services holding company, operating in the following segments: Individual retirement, group retirement, investment management and research, protection solutions, and wealth management. The company is based in New York, New York and was founded in 1859 by Henry B. Hyde.
While we acknowledge the risk and potential of EQH as an investment, our conviction lies in the belief that some AI stocks hold greater promise for delivering higher returns and doing so within a shorter time frame. If you are looking for an AI stock that is more promising than EQH and that has 10,000% upside potential, check out our report about the cheapest AI stock.
On a bullish note, UBS ******* yst Michael Ward CFA raised the firm's price target on Equitable Holdings Inc. (NYSE:EQH) from $58 to $63 while keeping a Buy rating on the shares. The ******* yst cited stronger-than-expected ******* et growth and improving investment performance, which he believes will support higher earnings. He also said that the company's ******* ets under management have recovered significantly despite the recent retail outflows. This has brought the combined business close to $1 trillion in ******* ets.
Moreover, Michael Ward highlighted the expected benefits of the planned merger with CRBG. According to the ******* yst, the deal will increase Equitable Holdings' scale, attract a broader investor base, and enhance its chances of joining major stock indexes. Despite concerns over execution, he expects the company to achieve its planned $500 million in cost savings.
Equitable Holdings Inc. (NYSE:EQH) is a financial services holding company, operating in the following segments: Individual retirement, group retirement, investment management and research, protection solutions, and wealth management. The company is based in New York, New York and was founded in 1859 by Henry B. Hyde.
While we acknowledge the risk and potential of EQH as an investment, our conviction lies in the belief that some AI stocks hold greater promise for delivering higher returns and doing so within a shorter time frame. If you are looking for an AI stock that is more promising than EQH and that has 10,000% upside potential, check out our report about the cheapest AI stock.

4 months ago
Investors poured $210 billion into US-listed ETFs in June, pushing year-to-date inflows past $1 trillion and putting 2026 on track for a $2 trillion haul if the current pace holds.
US equity ETFs did most of the heavy lifting for the month, taking in $103 billion. Fixed income funds followed with $46 billion, international equity ETFs added $37 billion, and leveraged products picked up $15 billion. The two categories in the red were commodities, which lost $6 billion, and currency ETFs, which shed $4.6 billion.
The backdrop was a strong one. US stocks climbed to fresh records during the second quarter after finishing near their lows for the year at the end of Q1, when the war involving Iran, Israel and the US rattled markets. The S&P 500 was up more than 10% at the midpoint of the year, and the Nasdaq-100 had gained over 20%.
International stocks also performed well, rising around 14%, while bonds managed only a fractional gain.
The flows data, which comes courtesy of FactSet, showed the iShares Core S&P 500 ETF (IVV) at the top of the June leaderboard.
Right behind it was the Roundhill Memory ETF (DRAM), the breakout hit that has become one of the fastest-growing ETFs of all time. The fund pulled in almost $10 billion during the month, lifting its ***** ets above $25 billion. Another AI winner, the iShares Semiconductor ETF (SOXX), collected $4.1 billion.
Returns for both ETFs have been remarkable. SOXX is up 113% so far this year, most of that coming in the second quarter, and DRAM has gained 166% since it launched in April.
Other standouts on the inflows side included the iShares Systematic Alternatives Active ETF (IALT), which took in $4.3 billion in what looks like a model portfolio or institutional allocation. The iShares 0-3 Month Treasury Bond ETF (SGOV) added nearly $4 billion, making it the biggest fixed income winner of June.
The outflows column was led by the iShares MSCI EAFE Value ETF (EFV), which lost $5.6 billion. The ETF gained 10% through the first half of the year, which is respectable, but trailed the broader international category.
Another value fund, the iShares MSCI USA Value Factor ETF (VLUE), gave up $5.4 billion even as it turned in one of the stronger performances of any fund this year, up 47% on the back of well-timed stakes in Micron and Cisco, two tech names that have taken off.
Rounding out the June outflows list were the iShares Bitcoin Trust (IBIT) and the SPDR Gold Shares (GLD), which shed $3.4 billion and $3.2 billion. Both bitcoin and gold have had a rough year, down 33% and 7%.
A full list of the top inflows and outflows for June and for 2026 so far appears in the tables below.
US equity ETFs did most of the heavy lifting for the month, taking in $103 billion. Fixed income funds followed with $46 billion, international equity ETFs added $37 billion, and leveraged products picked up $15 billion. The two categories in the red were commodities, which lost $6 billion, and currency ETFs, which shed $4.6 billion.
The backdrop was a strong one. US stocks climbed to fresh records during the second quarter after finishing near their lows for the year at the end of Q1, when the war involving Iran, Israel and the US rattled markets. The S&P 500 was up more than 10% at the midpoint of the year, and the Nasdaq-100 had gained over 20%.
International stocks also performed well, rising around 14%, while bonds managed only a fractional gain.
The flows data, which comes courtesy of FactSet, showed the iShares Core S&P 500 ETF (IVV) at the top of the June leaderboard.
Right behind it was the Roundhill Memory ETF (DRAM), the breakout hit that has become one of the fastest-growing ETFs of all time. The fund pulled in almost $10 billion during the month, lifting its ***** ets above $25 billion. Another AI winner, the iShares Semiconductor ETF (SOXX), collected $4.1 billion.
Returns for both ETFs have been remarkable. SOXX is up 113% so far this year, most of that coming in the second quarter, and DRAM has gained 166% since it launched in April.
Other standouts on the inflows side included the iShares Systematic Alternatives Active ETF (IALT), which took in $4.3 billion in what looks like a model portfolio or institutional allocation. The iShares 0-3 Month Treasury Bond ETF (SGOV) added nearly $4 billion, making it the biggest fixed income winner of June.
The outflows column was led by the iShares MSCI EAFE Value ETF (EFV), which lost $5.6 billion. The ETF gained 10% through the first half of the year, which is respectable, but trailed the broader international category.
Another value fund, the iShares MSCI USA Value Factor ETF (VLUE), gave up $5.4 billion even as it turned in one of the stronger performances of any fund this year, up 47% on the back of well-timed stakes in Micron and Cisco, two tech names that have taken off.
Rounding out the June outflows list were the iShares Bitcoin Trust (IBIT) and the SPDR Gold Shares (GLD), which shed $3.4 billion and $3.2 billion. Both bitcoin and gold have had a rough year, down 33% and 7%.
A full list of the top inflows and outflows for June and for 2026 so far appears in the tables below.