

1 month ago
Steel and materials markets fluctuated between rallies and pullbacks as the US-Canada trade relationship shifted from near agreement to open dispute. Nucor Corporation (NYSE:NUE) and Cleveland-Cliffs Inc. (NYSE:CLF) rose on August 25, after discussions between the two countries broke down, a turnaround from the week before, when several of the same stocks fell on hopes that a new deal would decrease steel and aluminum tariffs. The VanEck Steel ETF gained 1.6% on the day, while the State Street Materials Select Sector SPDR reached an intraday high. The rise didn't last: by the end of the week, the materials ETF had slipped to negative territory, while the steel ETF was about flat, though, both remain substantially up for 2026.
The volatility traces a rapid escalation. On August 19, Bloomberg reported that the US and Canada had tentatively agreed to reduce tariffs on Canadian steel and aluminum to 25% and vehicle charges to 15%. That optimism was dashed within days: on August 22, the US imposed 50% tariffs on a wide variety of Canadian exports, and Canadian Prime Minister Mark Carney responded by declaring Canada officially "at war" with the United States, saying "You're at war when you're attacked, and we got attacked."
On August 25, Ottawa announced counter-tariffs of C$27.6 billion on American goods, which took effect on September 8 at rates ranging from 15% to 50%. The dispute has continued to escalate since then, with Washington announcing additional restrictions and tariffs on Canadian goods in September, reinforcing the view that a quick resolution remains unlikely.
Atsi Sheth, Moody's chief credit officer, put it bluntly: "Expect much more of this uncertainty for some time to come." Investors initially welcomed tariffs as good news for US steelmakers facing less Canadian competition, but the back-and-forth negotiations, as well as Canada's reaction, have made predicting a steady outcome difficult.
The more intriguing story is how differently the aforementioned companies are positioned. Nucor Corporation (NYSE:NUE) relies primarily on scrap-based electric arc furnace steelmaking, while Cleveland-Cliffs Inc. (NYSE:CLF) operates a vertically integrated model with internally sourced iron ore, scrap and other raw materials. Both have meaningful domestic raw-material exposure, although their production models differ substantially. Nucor Corporation (NYSE:NUE) is up more than 50% year-to-date, while Cleveland-Cliffs Inc. (NYSE:CLF), despite similar structural insulation, remains negative for 2026, which **** ysts attribute to balance sheet stress rather than tariffs.
#august #nucor #corporation #cleveland


2 months ago
Apple is skipping the base iPhone 18 this fall in favor of three premium devices: the iPhone 18 Pro, the iPhone 18 Pro Max, and its first foldable — rumored to be called the iPhone Ultra, Duo, or Fold. The foldable is the headline. It's expected to feature a 7.8-inch internal display, a 5.3-inch external screen, an A20 Pro chip, and a thickness of just 4.5mm unfolded, with pricing estimated between $1,999 and $2,399 and limited initial supply. It marks Apple's entry into the foldable category years after rivals — a potentially major new product cycle for one of the world's most valuable companies.
Here's the pattern every ETF investor should understand before today's close. Nearly two decades of data show that Apple tends to "sell the news" on launch day itself. AAPL averages a roughly 0.3% decline on iPhone launch days, with a median drop of about 0.6% — the classic case of anticipation being priced in before the reveal.
But the weakness rarely lasts. Apple has averaged a 0.5% gain the very next session (positive in 15 of 24 releases), and the longer-term picture is decisively bullish: AAPL has gained in the 60 days following an iPhone reveal 17 times since the original 2007 launch. The biggest such move was a 20% gain in the 60 days after the iPhone 11 reveal in 2019. In other words, launch-day dips have historically been buying opportunities, not warning signs. **** ysts have also downplayed fears about the ~$2,000 foldable price tag, arguing a premium halo product is unlikely to dent Apple's overall economics.
Apple is not just a stock — it's one of the largest weights in the entire ETF universe. As one of the biggest companies in the world, it sits near the top of the S&P 500, the Nasdaq-100, and virtually every technology index. That means a move in AAPL ripples through hundreds of funds, and millions of investors have significant Apple exposure without realizing it. When Apple moves on event day, these are the ETFs that move with it.
A handful of funds carry outsized Apple weights and will feel today's move most acutely. GXPT (Global X PureCap MSCI Information Technology ETF) holds roughly 19.2% in Apple — the highest of any diversified fund. FTEC (Fidelity MSCI Information Technology Index ETF) holds about 16.3%, VGT (Vanguard Information Technology ETF) about 16.2%, TRUT (VanEck Technology TruSector ETF) roughly 15.1%, and TOPT (iShares Top 20 U.S. Stocks ETF) around 14.5%. For these funds, Apple is a dominant driver of daily returns.
#iphone #foldable #launch #aapl


2 months ago
Investors added $27.2 billion to US-listed ETFs during the week ending Friday, Aug. 28, pushing year-to-date inflows to $1.38 trillion.
International equity ETFs led the way with $9.1 billion, followed by US fixed income ETFs with $8.6 billion. US equity ETFs took in a relatively modest $2.3 billion, less even than the $2.5 billion that went into currency funds.
The backdrop was a firmer stock market and a softer bond market. The S&P 500 rose about 1% last week, while the 10-year Treasury yield ticked a few basis points higher. On Monday it climbed further, reaching as much as 4.77%, its highest level since January 2025.
Judging by the flows, ETF investors have been treating those higher yields as a buying opportunity.
At the individual fund level, the Vanguard S&P 500 ETF (VOO) led with $11.4 billion, lifting its year-to-date haul to a whopping $106 billion. The Vanguard Short-Term Treasury ETF (VGSH) followed with $2.7 billion.
Meanwhile, both the AI trade and the debasement trade remained in play, with $1.6 billion flowing into the VanEck Semiconductor ETF (SMH) and $1.2 billion into the iShares Bitcoin Trust ETF (IBIT).
For a full list of last week's top inflows and outflows, see the tables below.
Ticker
Name
Net Flows ($, mm)
AUM ($, mm)
#etfs #vanguard #flows #week


2 months ago
Investors just moved a record $7 billion into gold and Bitcoin (BTC) funds in five days. Bitwise CIO Matt Hougan blames a flaw in the 60/40 portfolio, which is 100% exposed to fiat currency.
Bloomberg senior ETF ******* yst Eric Balchunas calls it the debasement trade, a bet on ******* ets no government can print. This week, that bet pushed AI funds out of the headlines.
SPDR Gold Shares (GLD) took in $3.4 billion in the week through August 21. BlackRock's iShares Bitcoin Trust (IBIT) added just over $1 billion, data shows.
Meanwhile, the VanEck Semiconductor ETF (SMH) bled $1.7 billion, more than any other fund. Money did not leave the market. It switched sides.
"DEBASER: Gold and Bitcoin ETFs have combined for +$7b in flows in past week, by far a record for a 5-day period as debasement trade steals spotlight from AI. GLD, IBIT leading, in Top 10 for week. Also notable $IBIT YTD flows are now positive, completely dug out of sizable hole," Balchunas shared.
#trade


2 months ago
GDX sits 22% below its peak despite gold at record $4,270, while GDXJ's junior miners deliver the operational leverage the seniors are missing.
GLDM tracks bullion at a lower cost than GDX, making it the cleaner choice for investors seeking a pure hedge over mining equity exposure.
Read More: Learn 7 secret wealth tips high net worth investors use that most investors miss (sponsor)
Gold trading near $4,270 should have been a coronation for VanEck Gold Miners ETF (NYSEARCA:GDX). Instead, GDX holders own a fund that has gained 76.34% over the past year, yet still sits roughly 22% below its 52-week high of $117.16. The gap between the metal and the miners is the core reason to own GDX, and that gap remains wide. A related VanEck product has historically closed it, and most GDX holders already know its name without owning it.
GDX is the default vehicle for gold-mining equity exposure. It holds the majors, with Newmont at 10.37%, Agnico Eagle at 10.12%, and Barrick at 6.01%, and the top 10 positions account for 56.30% of **** ets. Investors buy it because it turns a directional view on bullion into equity beta without picking a single miner. Fees are reasonable at 0.51%, and the fund carries a beta of 0.67 against the broader market, which is why it slots into diversification buckets. Those are the reasons GDX sits in so many portfolios.
#Gold #vaneck #bullion #mining


2 months ago
Your run-of-the-mill AI ETF might plunge when the data center buildout stops
This ETF does not rely on it, while keeping significant exposure to it
With or without AI, nuclear-liked ETFs seem poised to do well long-term; here's why
Don't wait: the ***** yst who called NVIDIA in 2010 just revealed his top 10 AI stocks. See the full list FREE now.
If you're investing in AI in 2026 and you either want to start afresh or shift holdings, it's a good idea not to throw your money at the first thing that catches your eye. You need an AI ETF that can provide you with exposure to the AI boom while being solid for long-term growth without AI; the VanEck Uranium and Nuclear ETF (NYSEARCA:NLR) does just that.
#etfs #don 't #vaneck

2 months ago
Investors poured more than $56 billion into US-listed ETFs during the week ending Aug. 21, lifting year-to-date inflows past $1.3 trillion.
US equity ETFs took in about half the total at $25 billion. US fixed income added $12.5 billion, international equity funds gathered $5.6 billion, and international fixed income took in $2.5 billion.
Commodity ETFs were the notable standout, pulling in almost $5 billion, while currency funds at $2.2 billion and alternatives at $2.8 billion also had strong weeks.
The S&P 500 slipped a little over 1% last week, pulling back from the record highs it had set the week before. Bonds stayed under pressure even after the Treasury Department moved to support the market, announcing it would double the size of its long-dated debt buybacks.
Yields fell briefly on the news but quickly reversed, leaving the 30-year Treasury yield not far from the 19-year high above 5.3% it reached on Aug. 17.
The Treasury's attempts to keep long-term yields down revived the so-called debasement trade. The SPDR Gold Shares (GLD) took in $3.4 billion and the iShares Bitcoin Trust (IBIT) added more than $1 billion as both gold and bitcoin spiked. Gold is now back in the green, up around 8% on the year after spending much of the summer underwater. IBIT remains down about 10% in 2026, though that is a marked improvement from the 33% loss it was nursing at its worst point in June.
On the other side of the ledger, the VanEck Semiconductor ETF (SMH) led outflows, shedding $1.7 billion. Semiconductor stocks have been treading water lately, chopping up and down after starting the third quarter under pressure.
The broader AI trade remains intact, but it has grown increasingly volatile as investors go back and forth over whether the rally is sustainable and whether the group has already peaked.
For a full list of last week's top inflows and outflows, see the tables below
Ticker
Name
Net Flows ($, mm)
AUM ($, mm)
#etfs #year #took #down


2 months ago
The VanEck Pharmaceutical ETF (NASDAQ:PPH) offers concentrated exposure to established global drugmakers and higher yields, while the State Street SPDR S&P Biotech ETF (NYSEMKT:XBI) provides a diversified, higher-volatility play on smaller-cap biotechnology innovation.
Both funds offer paths into the healthcare sector but serve very different roles in a diversified portfolio. One focuses on the established stability and cash flows of global pharmaceutical giants, while the other captures the high-risk, high-reward nature of early stage biotechnology research. This **** ysis examines which profile fits your strategy.
Metric
XBI
PPH
#pharmaceutical #state

2 months ago
A couple of weeks ago during "Market on Close," I fielded a question about refining stocks like Valero (VLO), Marathon (MPC), and Phillips 66 (PSX). I basically said the price action represented a pause, because the market had mispriced the risk in the refined product market.
It's a supply-and-demand story I've also detailed in this ***** e with regard to the VanEck Vectors Oil Refiners ETF (CRAK), which is now up about 10% since I made those comments on the livestream, and spiking to new highs today.
As 30-Year Yields Spike to 5.31%, Our Top Chart Strategist Warns There's a Risk to Stocks: 'In a Word, Yes'
Cooler US Weather Forecasts Weigh on Nat-Gas Prices
Did the Commodities Complex See Turnaround Activity Overnight?
#market #stocks #marathon



2 months ago
When it comes to the market sub-segment devoted to investing in business development companies (BDCs) — and the VanEck BDC Income ETF (BIZD), which collects them into one tidy stock basket — there's a situation going on. I'd say these stocks are again catching a bid. But not after a first-half shellacking.
The chart below is a solid, optimistic chart to me. There's some rediscovery of this beaten-down market area. But don't kid yourself. As I'll discuss below, there are some major overhangs here, which can appear again at any time. For now, the upward price trend is heartening. And the PPO recently crossing above the important zero line has been correlated with nice up moves in the past.
A $210 Billion Reason to Buy AMD Stock Here
CoreWeave vs Nebius: Both Companies Reported Strong Earnings, But Here's the Stock You Should Buy
As Oracle Deepens Its Partnership with AWS, Here's How You Should Play ORCL Stock
#here #market #bizd


3 months ago
Trading in ETFs has exploded over the past few years, as a new generation of investors has come to the market and the number of funds has multiplied, offering exposure to just about every strategy imaginable.
What's interesting, though, is that the most actively traded ETFs aren't necessarily the biggest. Case in point is the Vanguard S&P 500 ETF (VOO). It's the only fund to cross $1 trillion in ******* ets, yet it barely makes the top 10 in terms of daily dollar volume.
The fund that dominates trading is the SPDR S&P 500 ETF Trust (SPY), which tracks the same index and was the largest ETF in the world for decades until VOO overtook it in 2025. It remains the runaway leader in activity, with almost $30 billion of the fund changing hands on Thursday.
The Invesco QQQ Trust (QQQ), which follows the tech-heavy Nasdaq-100, is a juggernaut in its own right, with nearly $24 billion in dollar volume.
After QQQ there is a steep drop off, though tech remains popular. The Direxion Daily Semiconductor Bull 3X Shares (SOXL) was the third most actively traded fund, with $7.6 billion changing hands.
That is an enormous figure for a fund with only $22.5 billion in ******* ets, a sign that SOXL is a trading vehicle above all else. The same is true of the ProShares UltraPro QQQ (TQQQ), which traded $4.4 billion.
SOXL and TQQQ are leveraged instruments that traders use to get amplified exposure to tech, and to the AI trade in particular. But plenty of activity went into unleveraged semiconductor funds as well.
The iShares Semiconductor ETF (SOXX) and the VanEck Semiconductor ETF (SMH) each traded roughly $4 billion. The two funds track the chip stocks that have benefited most from the AI boom.
The bearish versions drew heavy volume too, with the Direxion Daily Semiconductor Bear 3X Shares (SOXS) and the ProShares UltraPro Short QQQ (SQQQ) both landing in the top 20.
The chip theme extended overseas. The iShares MSCI South Korea ETF (EWY) traded $2.9 billion, and the Roundhill Memory ETF (DRAM), which is heavily weighted toward Korean names, traded $2.8 billion. Both cracked the top 15, a reflection of how central Korean memory makers have become to the AI story.
Outside of tech, the iShares Russell 2000 ETF (IWM) stood out with $4.9 billion, far and away the most actively traded small-cap fund. Small caps have had a strong year, rising 23% against 14% for large caps.
On the fixed income side, the iShares iBoxx $ Investment Grade Corporate Bond ETF (LQD), at $3.4 billion, and the iShares 20+ Year Treasury Bond ETF (TLT), at $2.3 billion, drew the most activity. Bonds have performed poorly this year amid expectations that the Federal Reserve could raise rates to fight resurgent inflation.
Gold remained a draw as well. The SPDR Gold Shares (GLD), with $4.3 billion, and the VanEck Gold Miners ETF (GDX), with $2.1 billion, both made the list, even though the metal has had a fairly tepid year.
A more surprising entrant in the top 20

3 months ago
The VanEck Semiconductor ETF (NASDAQ: SMH) is down around 20% from its high reached just a month ago. The artificial intelligence (AI) trade has cooled substantially as investors look for tangible positive results from these companies, not just aggressive spending on AI development.
That's what's partially caused Alphabet's and Meta Platforms' stocks to crater over the past few weeks. They've kept their foot on the gas with AI spending as free-cash-flow growth turns negative. Folks seem to be getting nervous about investing in companies that may be getting out over their skis.
Missed Nvidia in 2009? This Rare Signal Is Flashing Again. In 2009, a "Double Down" signal flashed for a little-known chipmaker called Nvidia. For the first time in years, that same "Total Conviction" signal is flashing for a company 1/100th the size of Nvidia. Continue »
Semiconductor stocks have gotten dragged down alongside these names. But that doesn't necessarily mean they're worth avoiding. In fact, if you follow the Warren Buffett mantra to "be greedy when others are fearful," it might actually be the smartest trade to make right now.
The VanEck Semiconductor ETF tracks the MVIS US Listed Semiconductor 25 index. It gives investors exposure to some of the largest companies that design and manufacture the chips powering artificial intelligence and data centers. Top holdings include:
#NVIDIA #down #vaneck


3 months ago
Investors added $191.3 billion to US-listed ETFs in July, pushing year-to-date inflows toward $1.3 trillion.
The AI trade stayed volatile through the month, but the broader stock market held near all-time highs. Bonds went the other way, with the 30-year Treasury yield climbing to a 19-year high.
By category, US equity ETFs led the way with $75 billion of inflows. International equity ETFs followed with almost $46 billion, then US fixed income with more than $39 billion. Leveraged ETFs took in $10.5 billion, and alternatives gathered $6.3 billion.
At the individual fund level, the usual broad-market suspects sat at the top. The Vanguard S&P 500 ETF (VOO) picked up nearly $20 billion, followed by the SPDR S&P 500 ETF Trust (SPY) with $14 billion and the SPDR Portfolio S&P 500 ETF (SPYM) with more than $8 billion.
Outside of the big broad-market US funds, AI-fueled ETFs dominated. The iShares Semiconductor ETF (SOXX) picked up $6.9 billion, the Direxion Daily Semiconductor Bull 3X Shares (SOXL) added $6.9 billion, the Roundhill Memory ETF (DRAM) took in $6.2 billion, the iShares MSCI South Korea ETF (EWY) gathered $4.8 billion, and the VanEck Semiconductor ETF (SMH) brought in $4.5 billion.
#semiconductor #market #spdr #inflows


3 months ago
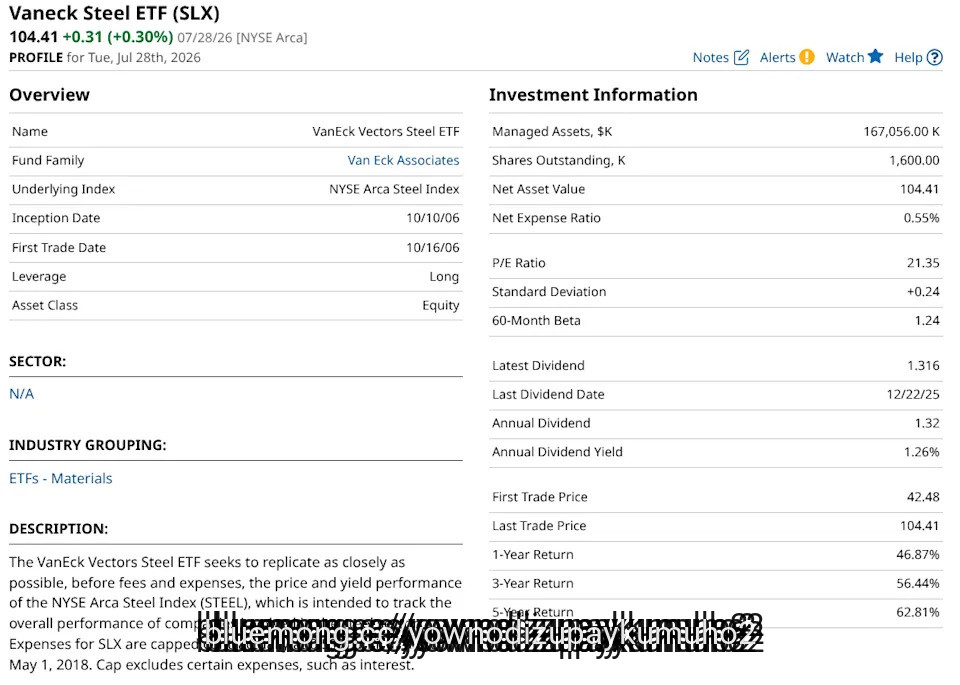
This stock market is shaky at best. Some might even say you need "nerves of steel" to navigate through it successfully.
As it turns out, the continued geopolitical turmoil has kept prices high for many commodities. And that has put a bid under commodity stocks, including, ironically, steel stocks. That makes the VanEck Steel ETF (SLX) a consideration for AI-weary investors.
CoreWeave Just Scored a Leidos Partnership. What That Means for CRWV Stock Here.
Palantir Is Set to Deliver Strong Q2. ***** ysts See 60% Upside Potential for PLTR Stock.
Earnings, PMI and Other Key Things to Watch this Week
#Stock #coreweave



3 months ago
The Nasdaq composite spiked up Thursday, with chip stocks a driver in the stock market's rebound from a sell-off in the previous session following the Federal Reserve's policy meeting. Chip equipment maker Lam Research (LRCX) shot higher on the stock market today on its raised outlook, while Meta Platforms (META) sank after its earnings report.
Near the end of the lunch hour in New York, the Dow Jones Industrial Average rose more than 500 points, or 1%. But a minority of the 30 stocks in the share-price-weighted index actually rose. Travelers (TRV) was the worst performer, falling 17 points, or 4%, to 371.75. The blue-chip index tumbled 2.1% on Wednesday. In Thursday's session, the S&P 500 reaccelerated its advance, rising 1.3% and not straying far from its intraday high of 7,417.
The tech-heavy Nasdaq composite, for now, was doing a better job of holding opening-hour gains than other indexes. It leaped 2.3%, adding to a jump of 1.7% minutes after the open. The composite index hit a session high of 25,112, up 8% for the year.
The Nasdaq-100 index picked up more than 3% following brutal sessions recently for memory and storage stocks. Lam shares on Thursday shot up 18%. The VanEck Semiconductor ETF (SMH) climbed nearly 7%.
Amazon (AMZN) and Apple (AAPL) are the next Big Tech companies set to release earnings reports, with their latest figures due late Thursday.
#NASDAQ #index


3 months ago
The Dow Jones Industrial Average climbed 659 points, or 1.3%, on Tuesday as strong earnings from Coca-Cola and Sherwin-Williams lifted blue-chip stocks while falling oil prices added support. The S&P 500 rose 0.3%, and the Nasdaq Composite finished little changed.
Sherwin-Williams stock surged 8% to pace the Dow after the paint maker topped second-quarter estimates. Coca-Cola stock climbed 5% after the beverage giant beat on both revenue and earnings and lifted its full-year guidance. Salesforce stock also gained 5%.
A broad rotation out of technology and into other sectors drove much of the day's action. The Technology Select Sector SPDR Fund hit its lowest level since May 7, while the State Street Health Care Select Sector SPDR ETF and Financials ETF surged to record highs. Consumer-staples stocks led the S&P 500 with a 2.7% gain.
The VanEck Semiconductor ETF dropped more than 3%, marking a fourth straight session of losses for chip stocks. Micron shares declined roughly 8% and AMD shed 7%. A drop of nearly 6% in the PHLX semiconductor index pushed the Nasdaq-100 into correction territory at its session low, though the index recovered to close above that threshold, according to the Wall Street Journal. Software names provided a partial cushion, as Microsoft advanced nearly 2% and the iShares Expanded Tech-Software ETF added close to 2%.
Mounting anxiety over AI spending levels and China's accelerating advances in the sector have pressured chip stocks, according to the Journal. The weakness extended across the Pacific, where South Korea's Kospi finished down 10% and ****** an's Nikkei lost 4%.
#Stock #williams

3 months ago
The bears may not be going anywhere on semiconductor stocks.
Quick insight: The VanEck Semiconductor ETF (SMH) — which counts Nvidia (NVDA), Taiwan Semiconductor (TSM), and Broadcom (AVGO) as its top three holdings — has begun to form a head-and-shoulders stock pattern, according to Yahoo Finance AlphaSpace chart ****** ysis (below).
The left shoulder took shape starting in mid-May, with the head forming in late June, and now the right shoulder has emerged. The pattern will be official if the ETF falls below the May 19 closing low of $543.
The head-and-shoulders pattern is widely considered bearish, as it suggests that buyers are gradually losing control of the market for a particular stock or ETF.
During the formation of the left shoulder and head, buyers can still push prices to new highs. But the inability to push higher on the right shoulder suggests that buyer demand is beginning to weaken.
#shoulder #pattern #Stock #suggests


3 months ago
BTCI's monthly payouts dropped from $1.04 to $0.65 in 2026, shrinking the forward yield to 8% versus a misleading 40% trailing headline.
Down 23% year to date with a -2% average annual return since inception, BTCI cushions Bitcoin losses but cannot prevent negative total returns.
Don't wait: the **** yst who called NVIDIA in 2010 just revealed his top 10 AI stocks. See the full list FREE now.
The NEOS Bitcoin High Income ETF (CBOE:BTCI) markets itself as a way to earn equity-like income from Bitcoin's volatility. BTCI pays monthly, uses a synthetic covered call overlay on Bitcoin exposure, and has distributed at rates translating into a headline yield well above 15%. This piece examines how BTCI generates that cash flow, whether the current distribution level is durable, and what trailing price action reveals about total returns.
This Bitcoin-oriented vehicle holds BTC exposure indirectly rather than through spot coins. According to the fund's holdings snapshot, roughly 56% of **** ets sit in U.S. Treasury bills, with Bitcoin exposure coming through positions in iShares Bitcoin Trust (roughly 13%) and VanEck's HODL (roughly 7%). The manager writes call options on Bitcoin ETFs and may layer in bear call spreads, a structure described in fund coverage as a synthetic covered call approach. BTCI's design aims to generate income while maintaining indirect exposure to Bitcoin price movements.
#btci

3 months ago
Nvidia (NVDA) CEO Jensen Huang's signed leather jacket sold for $960,000 Friday, the same day semiconductor stocks fell into a bear market. The contrast captures an AI boom with a cultural appeal that remains intact even as traders brace for much larger swings in its most important stocks.
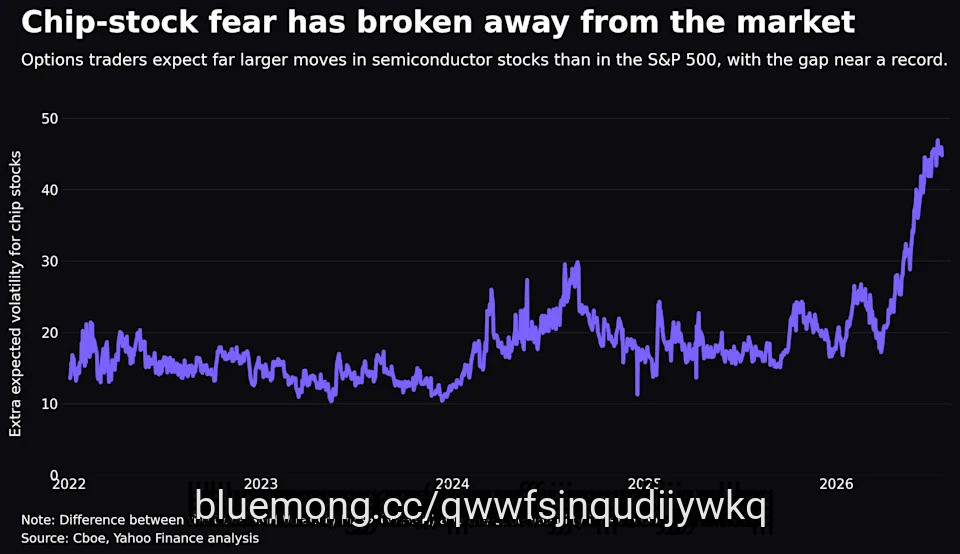
Fear has surged in chip stocks while remaining remarkably contained across the broader market. The Cboe SMH Volatility Index uses options prices to estimate expected movement over the next 30 days in the VanEck Semiconductor ETF (SMH). The Cboe Volatility Index (^VIX) measures the same basic thing for the S&P 500.
Subtracting one from the other shows how much extra turbulence traders expect from chip stocks. That gap recently reached nearly 47 volatility points and remains close to 45.
That is a striking departure from the broad market panic after the "Liberation Day" tariffs were announced in April 2025. When the VIX surged over 50, the chip volatility premium was less than half its current size.
Back then, fear was everywhere. Today, it is concentrated in chips.
#stocks #semiconductor #same

3 months ago
PBDC's real fund cost is 0.75%, not 13.49%, because SEC rules inflate the headline figure with BDC fees that BIZD investors also can't escape.
Three of PBDC's top four holdings show weakening earnings or cut dividends, and the fund trimmed its April payout 14% to $0.71.
Don't wait: the ***** yst who called NVIDIA in 2010 just revealed his top 10 AI stocks. See the full list FREE now.
The number that stops investors cold when they look at the Putnam BDC Income ETF (NYSEARCA:PBDC) is 13.49%. That is the total annual operating expense reported on the fund's fact sheet, and on its face, it looks disqualifying. No income ETF can survive a 13% fee drag. Yet PBDC still trades, still pays a meaningful distribution, and still has roughly $280 million in ***** ets. The reason: the headline number overstates what the fund actually pockets from your account. It reflects a disclosure quirk unique to funds that own business development companies, and understanding it changes the entire cost conversation around PBDC and its main passive rival, the VanEck BDC Income ETF (NYSEARCA:BIZD).
Business development companies are themselves operating businesses. They raise capital, employ investment teams, and charge management and incentive fees on the loan portfolios they run. When an ETF holds a basket of BDCs, SEC rules force it to disclose the pro rata share of those internal BDC fees as Acquired Fund Fees and Expenses on its own prospectus, even though the money never leaves the ETF's ***** ets. It is already netted out inside each BDC's earnings before those companies ever pay a dividend to the fund.
#bizd

3 months ago
The two largest semiconductor exchange-traded funds (ETFs) are the iShares Semiconductor ETF (NASDAQ: SOXX) and the VanEck Semiconductor ETF (NASDAQ: SMH). Combined, they have more than $115 billion in **** ets under management and are the two most popular ways to play the current chip rally.
At a high level, the two are pretty similar. Both have portfolios of around 25 to 30 names. They have nearly the same expense ratio. You might think the two are interchangeable.
Missed Nvidia in 2009? This Rare Signal Is Flashing Again. In 2009, a "Double Down" signal flashed for a little-known chipmaker called Nvidia. For the first time in years, that same "Total Conviction" signal is flashing for a company 1/100th the size of Nvidia. Continue »
They're not. In fact, some very simple differences in their construction strategies produce two very different portfolios. One factor in particular makes me think that the iShares Semiconductor ETF is the better choice moving forward.
These two ETFs hold mostly the same individual companies. SOXX holds a couple more, but that's only because of a slight variation in how the funds define semiconductor companies.


3 months ago
SPDR Gold Shares (NYSEMKT:GLD) provides direct exposure to physical bullion price movements, while VanEck Gold Miners ETF (NYSEMKT:GDX) offers a play on the equities of gold mining companies.
Investors looking for a haven in gold often face a choice between owning the commodity directly or investing in the companies that extract it. While one fund tracks the price of physical bullion, the other provides exposure to the operational leverage and equity risks of mining businesses. This **** ysis examines how these two popular vehicles compare in cost, volatility, and performance.
Metric
GDX
GLD

3 months ago
iShares Bitcoin Trust ETF (NASDAQ:IBIT) offers massive scale and liquidity, while VanEck Bitcoin ETF (NYSEMKT:HODL) provides slightly lower ongoing costs for investors seeking direct spot Bitcoin exposure.
Spot Bitcoin exchange-traded funds (ETFs) like these two funds provide investors with a streamlined way to gain exposure to the price of Bitcoin within a standard brokerage account. By holding the cryptocurrency in trust, these funds eliminate the complexities of managing digital keys and exchange wallets.
Metric
HODL
IBIT

4 months ago
This article was originally published on ETFTrends.com.
Welcome to Trends with Benefits, the podcast that gives you an insider's edge into finance, tech, and investing. Hosted by Ed Lopez, VanEck's Head of Product Management.
Explore why the S&P may be mispricing geopolitical risk, the case for India, the dollar's decline, and gold as a trade (not a strategy), with Mercer Advisors CIO Don Calcagni.
For more news, information, and strategy, visit the Beyond Basic Beta Content Hub.
POPULAR ARTICLES AND RESOURCES FROM ETFTRENDS.COM


4 months ago
Semiconductor stocks have dominated every performance leaderboard in 2026, with memory and equipment makers delivering triple-digit gains that dwarf the broader market.
Yet the fund capturing most of that upside is not the industry's largest, and it manages a fraction of the ****** ets held by the sector's biggest ETF.
The Invesco Semiconductors ETF (PSI) has returned about 103.6% year to date through early July, Benzinga reported on July 6.
That figure towers over the roughly 66.2% gain posted by the much larger VanEck Semiconductor ETF (SMH) during the same period.
The roughly 37-point gap between two funds fishing from the same pool of chip stocks traces to a single overlooked variable: how the underlying index weights its holdings.

4 months ago
No pair dominated ETF.com's comparison tool in the first half of 2026 more than the VanEck Semiconductor ETF (SMH) against the iShares Semiconductor ETF (SOXX), with 6,743 views. With the AI infrastructure buildout continuing to fuel explosive demand for chips, it's little surprise investors want to know which semiconductor ETF belongs in their portfolio.
On the surface, these two funds look nearly identical — same sector, overlapping holdings, nearly identical expense ratios (SMH at 0.35%, SOXX at 0.34%). But dig into the details and meaningful differences emerge.
The biggest distinction is portfolio construction. SMH holds just 26 stocks, making it a highly concentrated bet on the sector's largest players. NVIDIA alone represents 17.55% of the fund. SOXX, by contrast, holds 31 names and applies a more equal-weight tilt — NVIDIA sits at just 6.81% there, while Micron Technology and AMD each carry larger weights than in SMH.
That difference in construction has translated into divergent performance. Over the trailing year through mid-2026, SOXX returned 169.68% compared to SMH's 135.91% — a stunning gap driven in part by SOXX's heavier exposure to names that outperformed. Over three years, however, SMH holds the edge, returning 63.44% against SOXX's 56.95% CAGR.
Size is also a factor: SMH is the larger fund at $74.4B in AUM versus SOXX's $45.9B, and SMH's average daily dollar volume of $6.1B gives it a slight liquidity advantage. For investors who want pure, high-octane semiconductor exposure in a liquid wrapper, this debate isn't going away anytime soon.

4 months ago
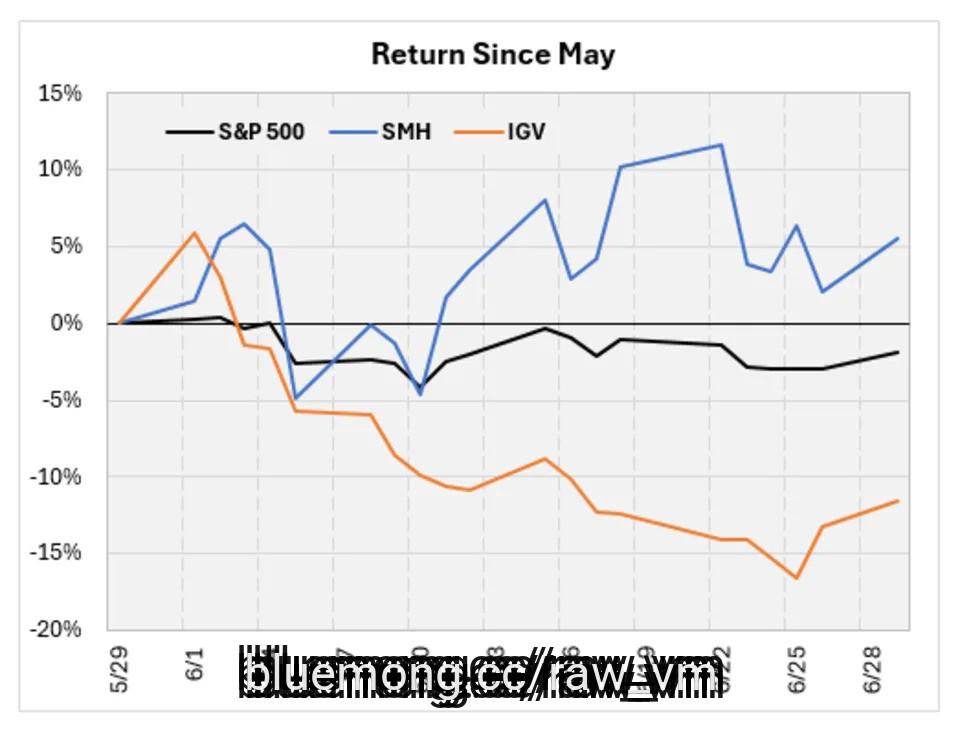
At the beginning of June, I wrote about two sector exchange traded funds (ETFs) that had become significantly overextended. The VanEck Semiconductor ETF (SMH) was trading more than 50% above its 200-day moving average, while the iShares Software ETF (IGV) was over 25% above its 50-day moving average.
Historical data showed that after reaching these extreme levels, sector ETFs tended to experience a short-term pullback before resuming a longer-term uptrend. Specifically, it highlighted the following month's underperformance and outperformance. Since May, however, SMH has chopped around to a 5% gain. IGV has pulled back sharply potentially creating a buying opportunity if history is any indicator.
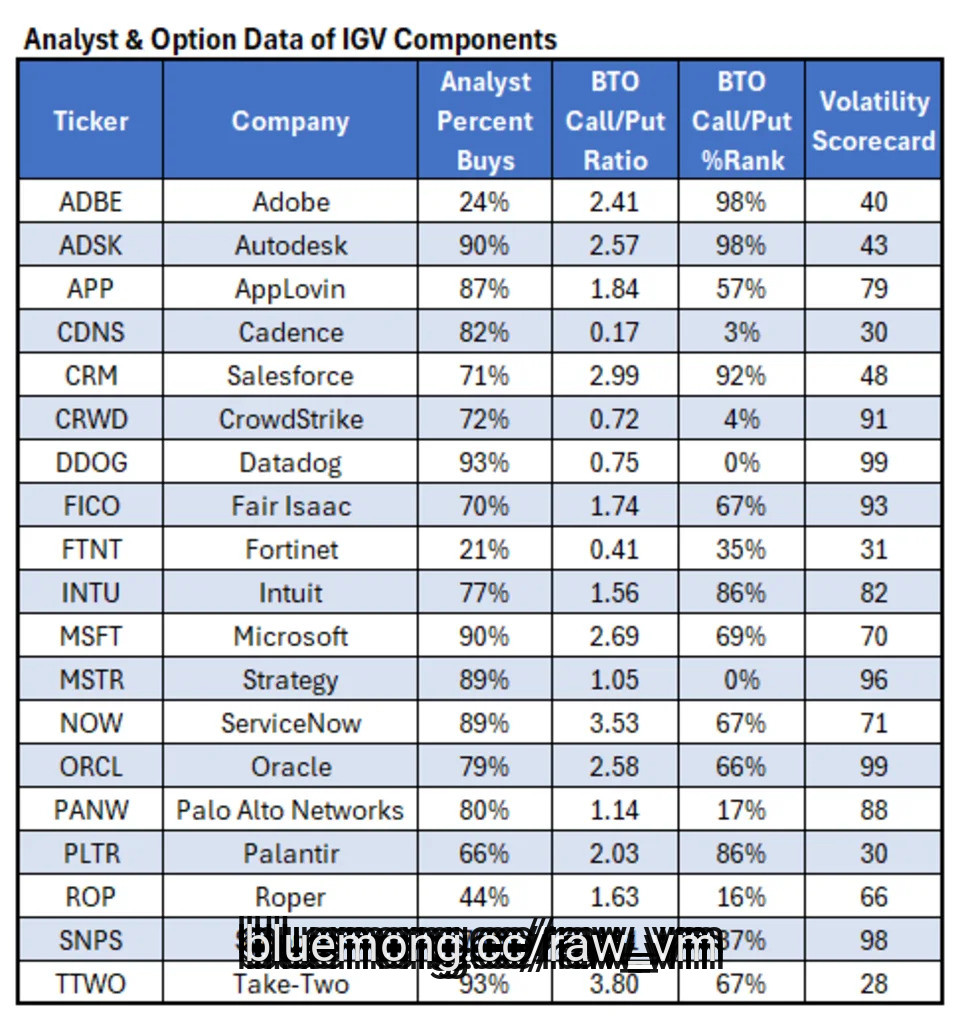
Plus, with that historical trend in mind, IGV could outperform for the next several months. In this article, I'll look at the stock holdings of the ETF and see if we can find some favorite individual plays based on the data.
The table below lists the top holdings of the IGV software ETF along with some stock performance data. I show month-to-date, year-to-date, and year-over-year returns. The last column in the table shows where the stock is relative to the last year of trading (0% means it's at its low and 100% means it's at its high).
I sorted the list by the stock's performance since the end of May. For those looking for pullbacks, since that's the pattern that has played out in the past, it's the stocks at the top of the table that have pulled back the most recently. If you're looking for a pullback but want to avoid a beaten down stock, AppLovin' (APP) has pulled back sharply, though its 52-week range shows 41%. Several stocks near the bottom of the table have been strong long-term and held up well over the past month when most of the sector had struggled.


4 months ago
You can find original article here WealthManagement. Subscribe to our free daily WealthManagement newsletters.
Carlyle to Add Weather-Risk Insurance Impact in Valuing ***** ets "The $475 billion private equity giant is collaborating with insurance broker Marsh on the new approach. Engineers, other insurers and climate risk experts are also contributing to discussions." (FundFire)
Post-SpaceX IPO, Investors Pour $83B Into U.S. Equities "While basic, passive S&P 500 exposure via the iShares Core S&P 500 ETF (IVV) drew in the most aggregate flows last week, the $8.3 billion and $7.4 billion into the Technology Select Sector SPDR Fund (XLK) and the VanEck Semiconductor ETF (SMH) respectively underscore the ongoing popularity of all things tech for investors." (ETF.com)
Why Most Stocks Aren't Worth Owning "Earlier this year, Bessembinder updated his research in One Hundred Years in the U.S. Stock Markets. Studying roughly 30,000 US stocks between 1926 and 2025, he found that less than half posted positive returns and just 41.17% outperformed the US Treasury bill. Just 46 stocks accounted for half the $91 trillion of wealth created." (Morningstar)
Tax-Aware Long-Short Investing: Not Just A Tax Overlay, But A Risk-Managed (Active) Investment Strategy "A portfolio made up of many individual securities, on the other hand, has many more potential loss opportunities that can be individually harvested (even though the performance of the individual-securities portfolio might be the same in aggregate as the broad-index ETF portfolio) because each holding with a loss can directly be harvested - allowing that one position to be tax-loss harvested even if the portfolio and index as a whole are up." (Kitces.com)

4 months ago
It was seemingly unthinkable earlier this year as gold raced to new highs, but the yellow metal is now in the throes of a bear market. Using the SPDR Gold Shares (NYSEMKT: GLD), the largest gold-backed exchange-traded fund (ETF), as the measuring stick, bullion's bear market is confirmed by the ETF trading 22% below its 52-week high at the close of U.S. markets on June 16.
Not surprisingly, the commodity's slide is a serious drag on gold stocks. Just look at the VanEck Gold Miners ETF (NYSEMKT: GDX). The largest ETF dedicated to companies that extract gold from the Earth is some 25% off its 52-week high, joining its physical gold friends in the bear camp.
Missed Nvidia in 2009? This Rare Signal Is Flashing Again. In 2009, a "Double Down" signal flashed for a little-known chipmaker called Nvidia. For the first time in years, that same "Total Conviction" signal is flashing for a company 1/100th the size of Nvidia. Continue »
The VanEck ETF's recent weakness is a reminder that, while mining stocks are closely correlated with gold prices, these equities, broadly speaking, have a track record of overshooting the commodity's price movements in both directions. Plus, gold miners, including those held by this ETF, are often more volatile than gold itself. All that said, this mining ETF may offer an opportunity for risk-tolerant investors.
The easy answer is that gold will regain its groove, and that could happen if the Federal Reserve cuts interest rates. The gold/rates relationship is easily explained. Physical gold or an ETF such as the aforementioned SPDR fund yields no dividends or interest payments to investors, so when Treasury yields are elevated, low-risk U.S. government debt is simply more enticing to many investors than no-income gold.

5 months ago
Broad market indexes have surged over the last few months, with semiconductors leading the charge. Since the end of March, the VanEck Semiconductor ETF (SMH) is up over 60%, making it the top performer of the 34 sector ETFs I track. The table below lists the 10 sectors furthest above their 200-day moving average. SMH easily outpaces all other sectors, sitting more than 50% above the moving average. The next most overextended sector by this metric is the Invesco Solar ETF (TAN).
This next table ranks ETFs by their distance from their 50-day moving average. The iShares Software ETF (IGV) is first on the table with SMH trailing behind.
This week, I’m looking at historical instances when the ETFs extended above these moving averages. Let's carefully consider whether to grab onto the high-flying sector or look elsewhere for solid returns going forward.
Using my list of 34 sector ETFs, I found times their price reached 50% above their 200-day moving average, like SMH recently did. There were 16 prior instances with a summary of coinciding forward returns in the first table below. The second table summarizes the returns if you purchased the S&P 500 ETF (SPY) instead.
The returns are interesting and mixed suggesting volatility going forward. The ETFs averaged a 1% gain over the next two weeks beating the SPY 63% of the time. Though over the next month they were down 0.6% on average and beat the SPY only 33% of the time. At that time, the ETFs seemed to take off again because they averaged about 15%, and 22% returns over three and six months, respectively. The one-year average return of 18% seems fair but ETF returns beat SPY just 33% of the time over the next year.