

Bitcoin (BTC) may be approaching a long-term bottom as its weekly chart combines two bullish reversal signals: a falling wedge and a positive divergence between price and the relative strength index (RSI).
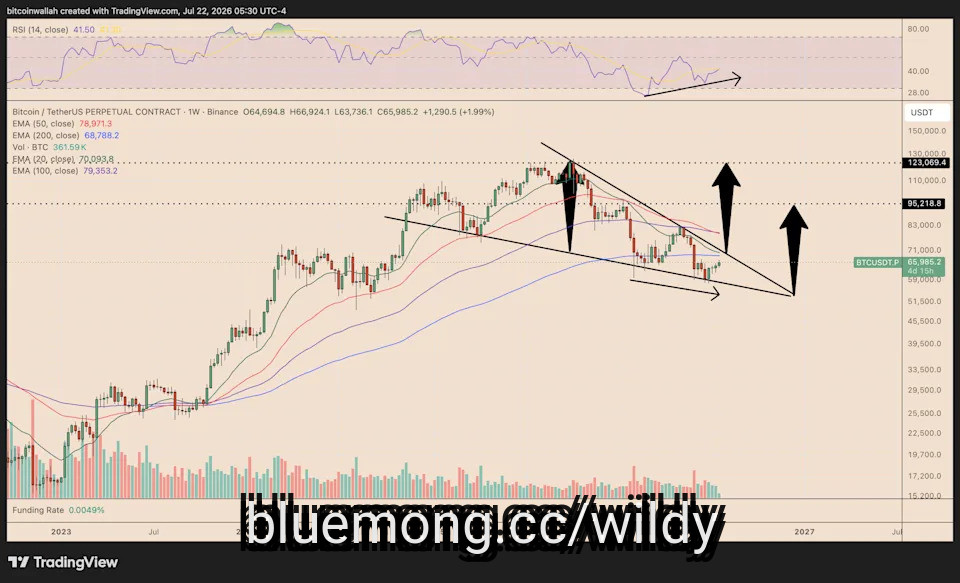
BTC was trading near $65,970 on July 22 after rebounding from the wedge's lower boundary. The setup suggests Bitcoin's correction may be losing momentum, although confirmation is still missing.
Bitcoin has traded inside a falling wedge since peaking near $123,000 in the second half of 2025.
A falling wedge forms when price declines between two converging trendlines. The narrowing range often indicates that sellers are losing control.
Bitcoin's weekly chart shows lower highs near $120,000, $95,000 and $80,000, while its downside moves have become smaller. BTC recently bounced from the $56,000–$59,000 region, where the wedge's lower trendline provided support.
#lower
BTC was trading near $65,970 on July 22 after rebounding from the wedge's lower boundary. The setup suggests Bitcoin's correction may be losing momentum, although confirmation is still missing.
Bitcoin has traded inside a falling wedge since peaking near $123,000 in the second half of 2025.
A falling wedge forms when price declines between two converging trendlines. The narrowing range often indicates that sellers are losing control.
Bitcoin's weekly chart shows lower highs near $120,000, $95,000 and $80,000, while its downside moves have become smaller. BTC recently bounced from the $56,000–$59,000 region, where the wedge's lower trendline provided support.
#lower

6 days ago