

Ether (ETH), the native token of the Ethereum protocol, has jumped roughly 25% in the past month, but a classic technical setup shows potential price correction ahead.
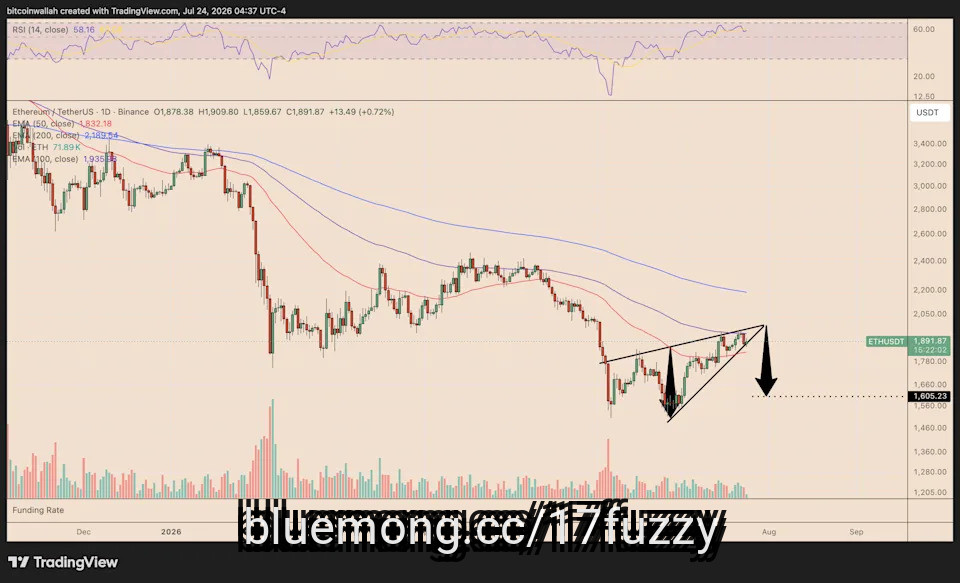
ETH was trading near $1,890 on July 24, having recovered from its June low near $1,510. However, the rebound has developed between two ascending, converging trendlines, creating the rising wedge structure.
A rising wedge typically reflects weakening bullish momentum because price continues to form higher highs and higher lows within an increasingly narrow range.
The pattern confirms when the price closes below its lower trendline with stronger trading volume and falls by as much as the maximum distance between the lower and the upper trendline.
For Ether, the wedge support appears near $1,830–$1,850, overlapping with its 50-day exponential moving average (50-day EMA, red) at approximately $1,832. Losing this support could accelerate the sell-off toward $1,600–$1,605, representing a decline of around 15% from current prices.
#ether #lower
ETH was trading near $1,890 on July 24, having recovered from its June low near $1,510. However, the rebound has developed between two ascending, converging trendlines, creating the rising wedge structure.
A rising wedge typically reflects weakening bullish momentum because price continues to form higher highs and higher lows within an increasingly narrow range.
The pattern confirms when the price closes below its lower trendline with stronger trading volume and falls by as much as the maximum distance between the lower and the upper trendline.
For Ether, the wedge support appears near $1,830–$1,850, overlapping with its 50-day exponential moving average (50-day EMA, red) at approximately $1,832. Losing this support could accelerate the sell-off toward $1,600–$1,605, representing a decline of around 15% from current prices.
#ether #lower

2 months ago